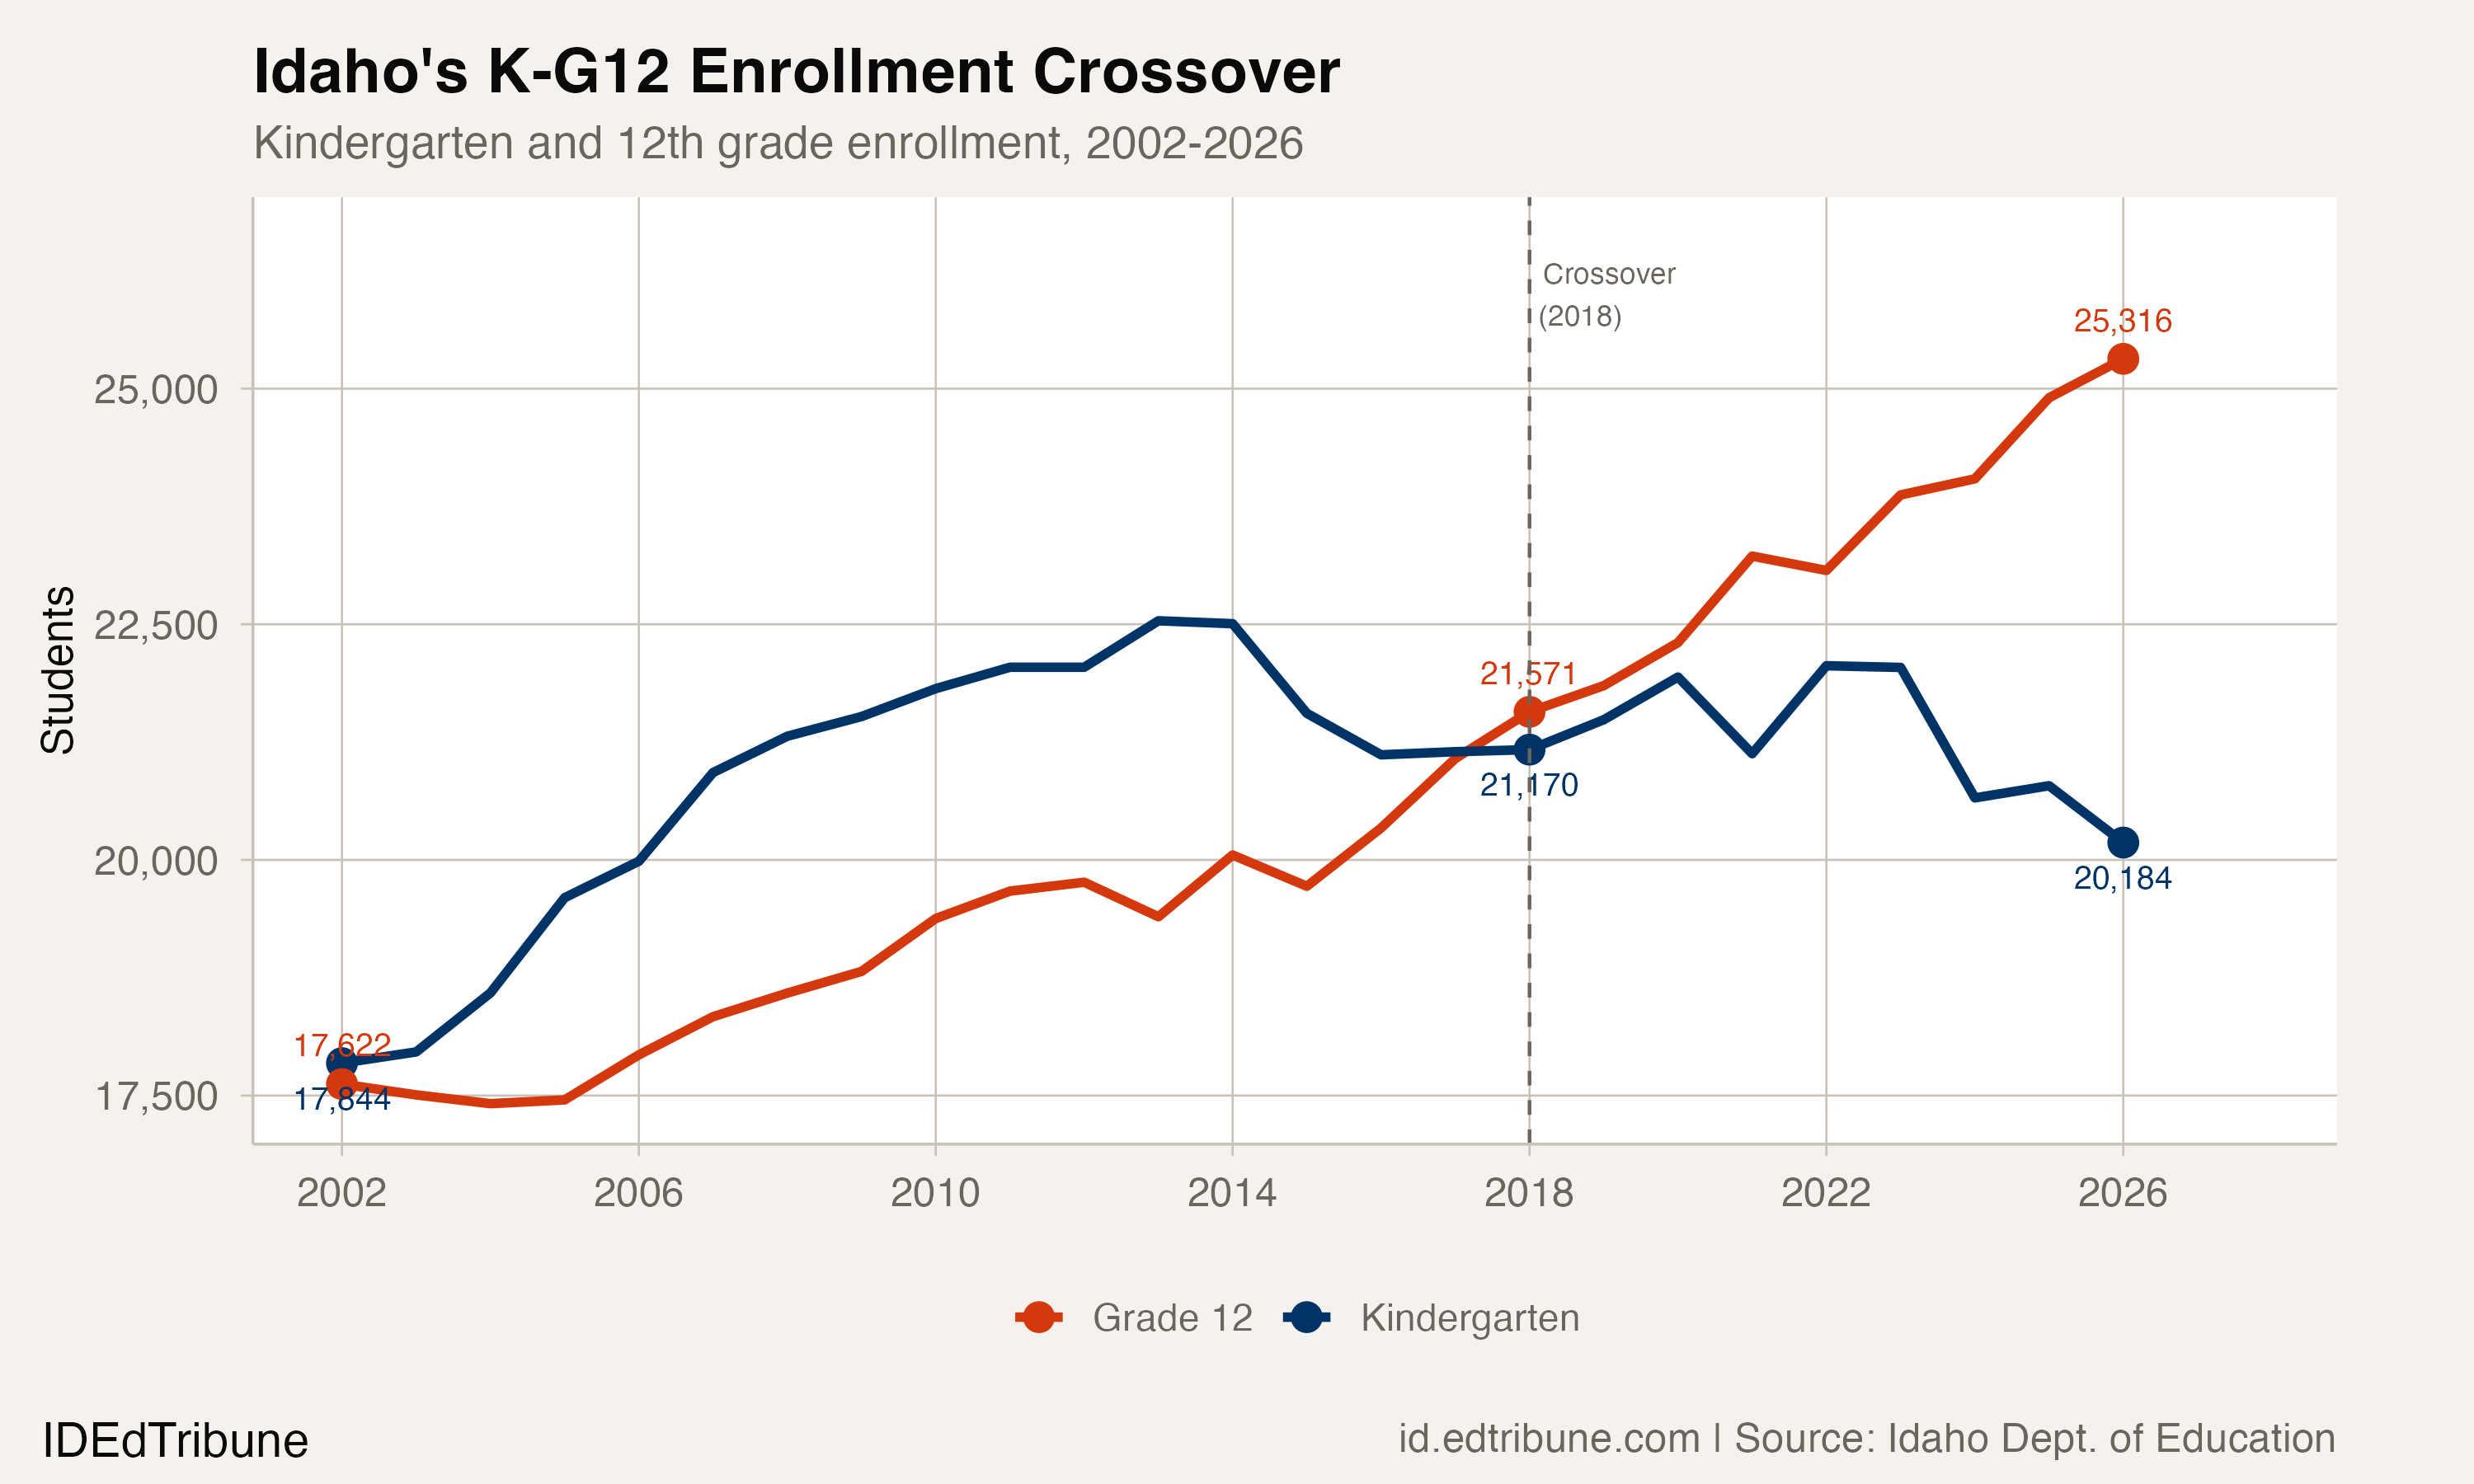
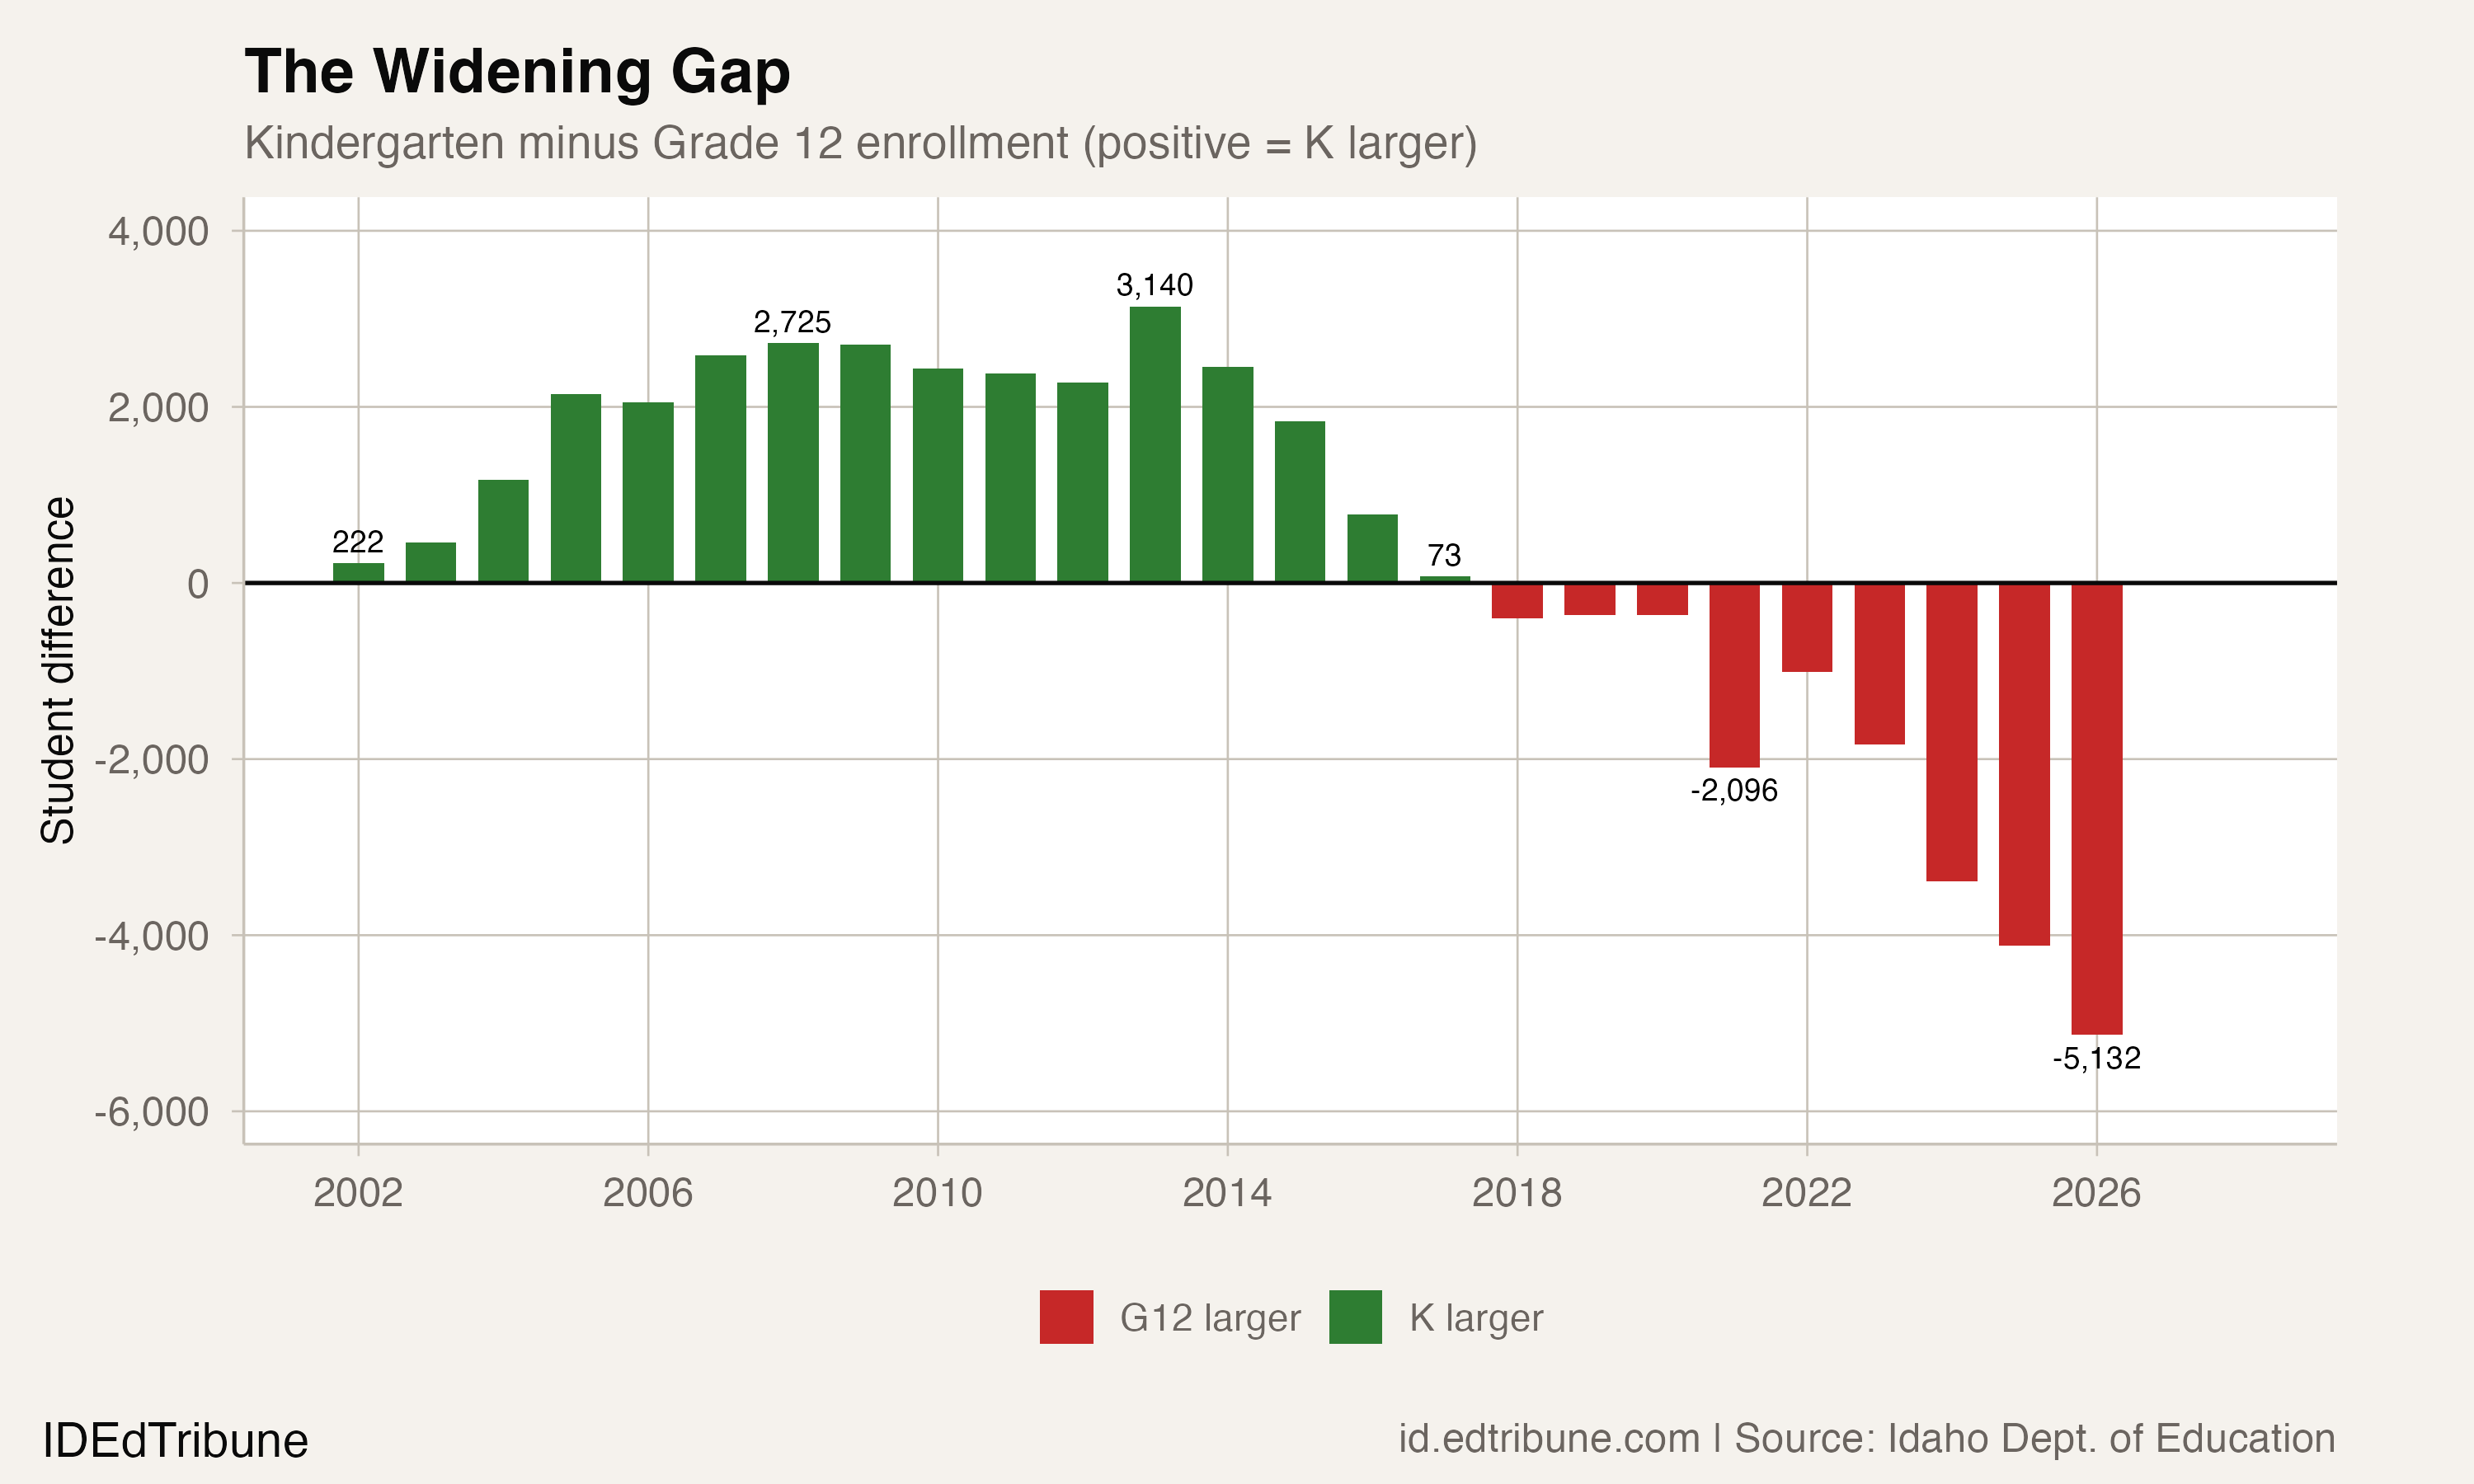
Idaho now has 5,132 more 12th graders than kindergartners. The front end of the pipeline used to be bigger than the back end — kindergarten classes were always larger because some students left along the way. That stopped being true in 2018, and the gap has widened every year since.
The crossover happened in 2018, when 12th grade enrollment first exceeded kindergarten. It was narrow then, just 401 students. Eight years later, grade 12 has pulled away: 25,316 students, an all-time high, compared to 20,184 kindergartners, down 10.4% from their 2013 peak.
The staircase
Walk through Idaho's 2026 enrollment grade by grade and the pattern is visible: each older cohort is larger than the one behind it. Kindergarten enrolled 20,184 students. First grade: 21,286. By third grade: 23,354. By ninth grade: 25,474, the single largest grade in the state. The system narrows slightly through high school but still graduates 25,316 seniors, 25.4% more students than it enrolls in kindergarten.
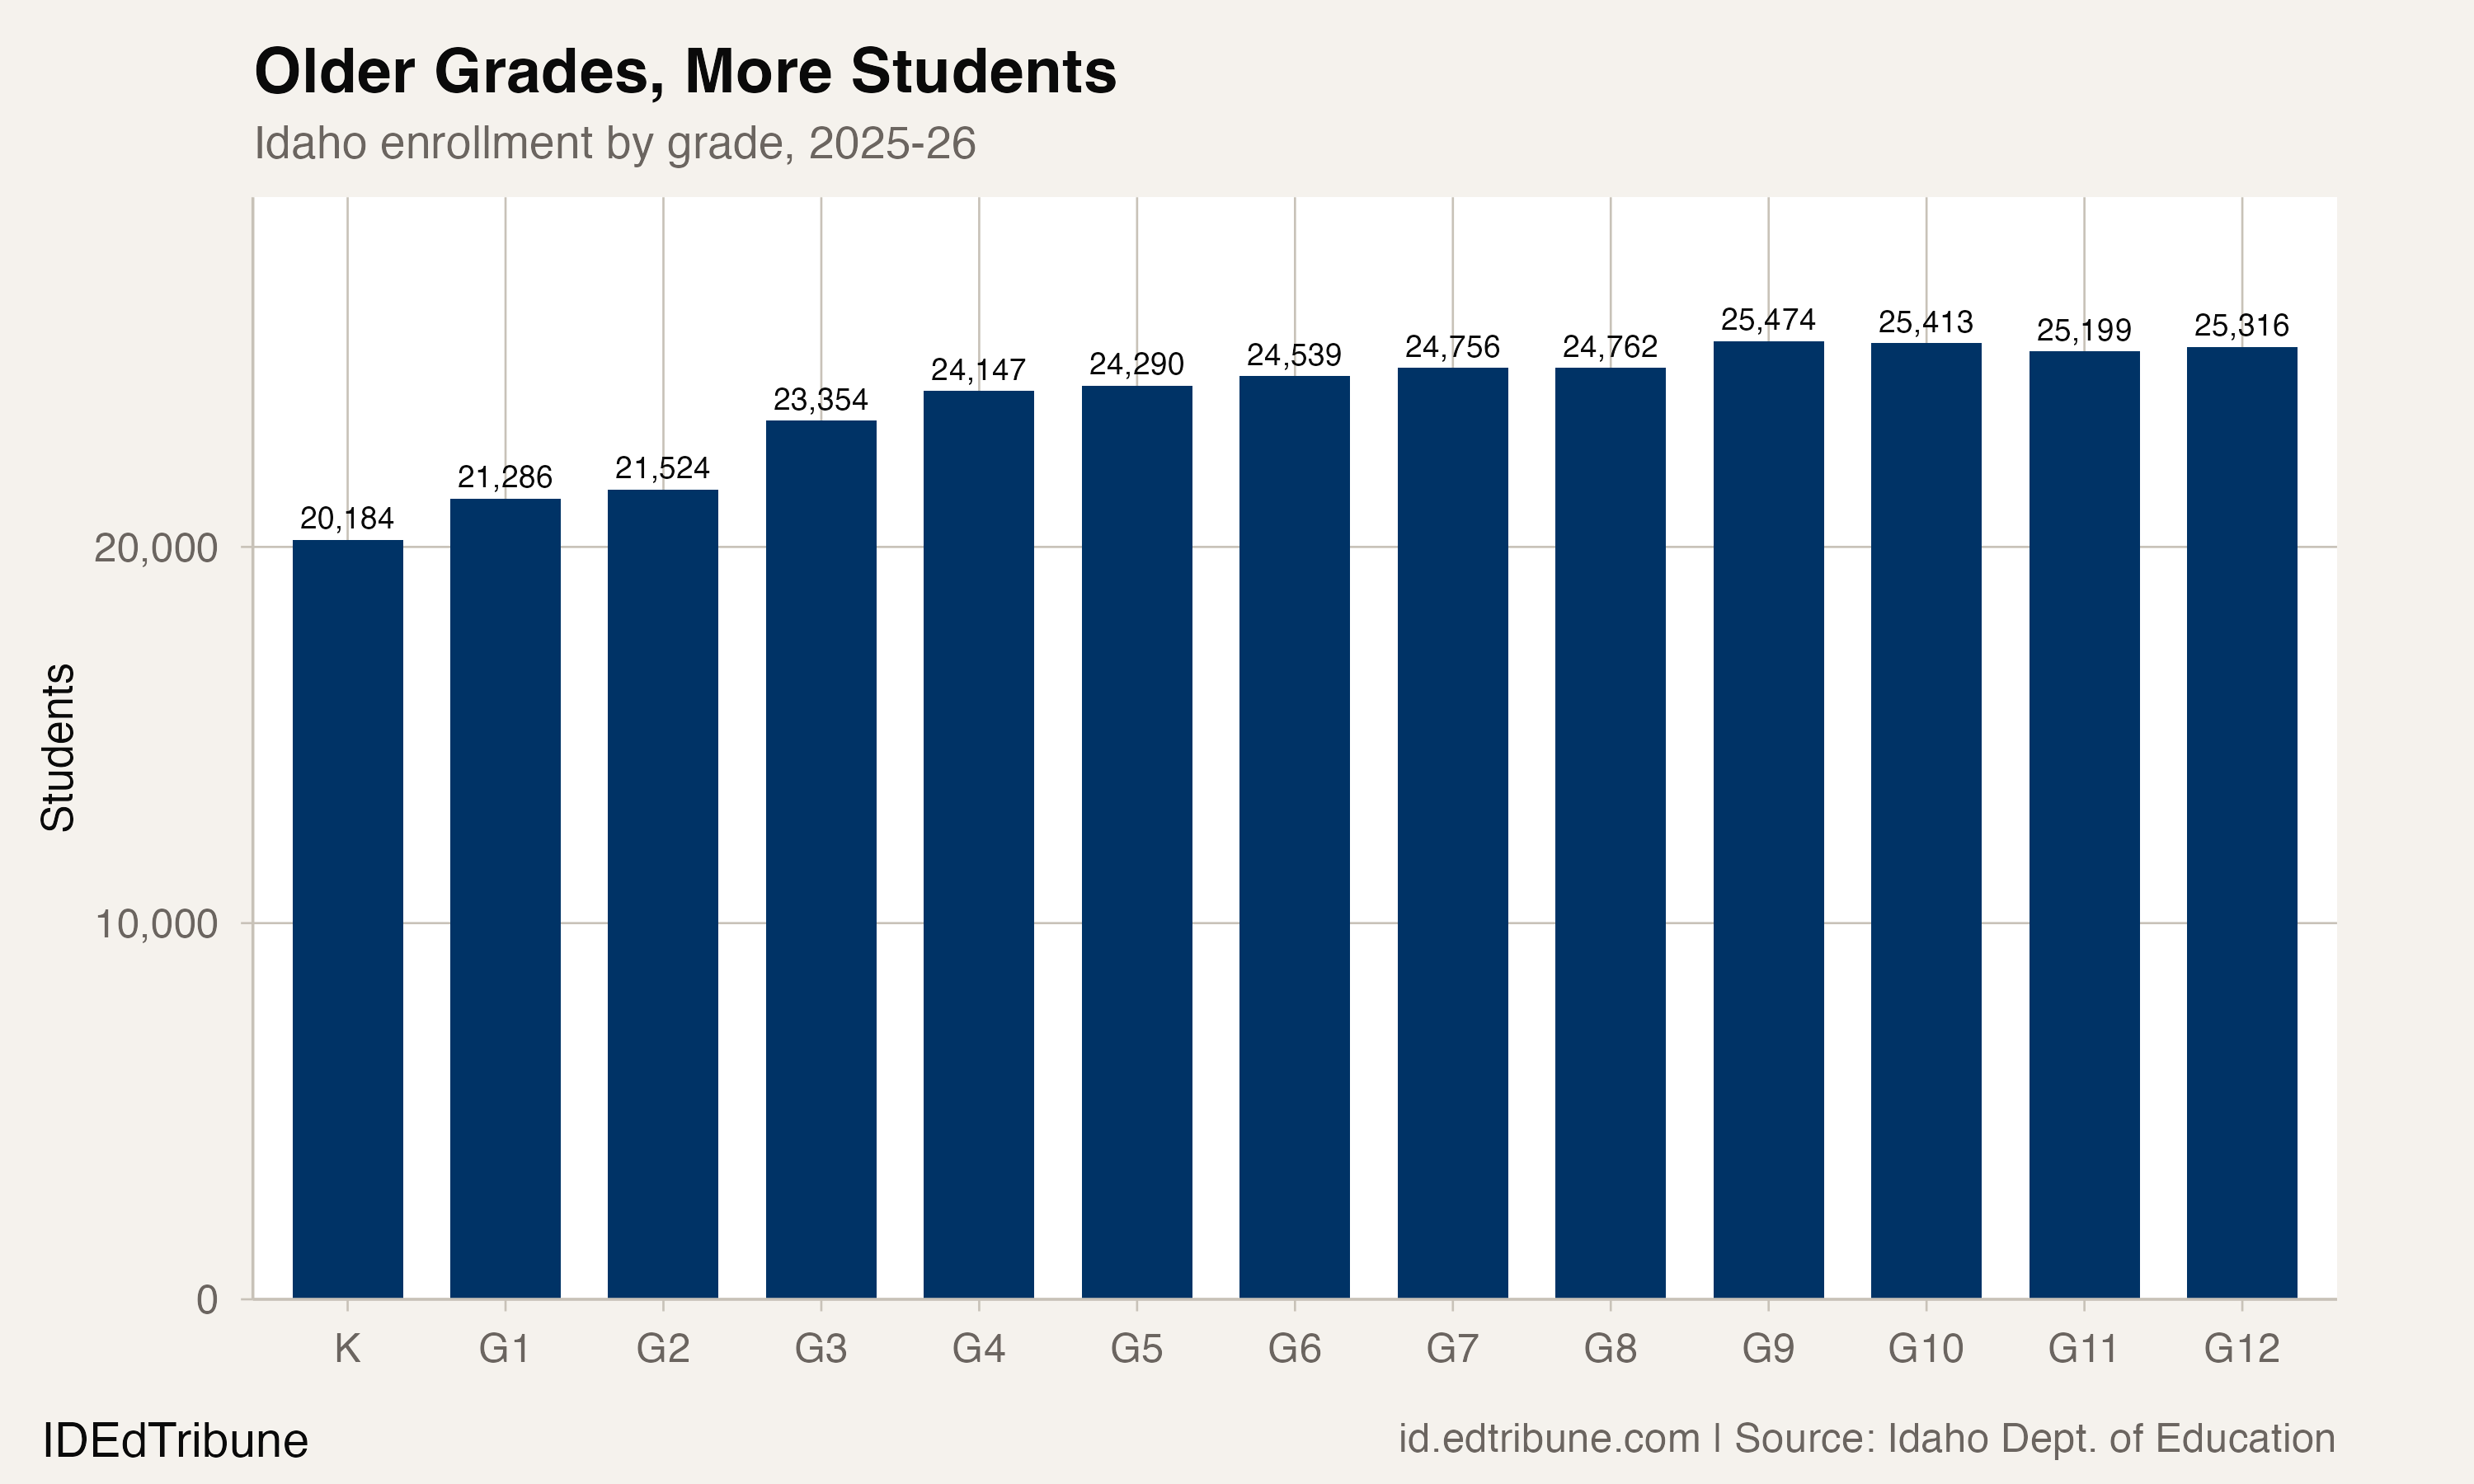
This ascending staircase is a demographic signature. Today's ninth graders were born around 2012, near the tail end of Idaho's birth peak. Today's kindergartners were born around 2020, well into the decline. Idaho recorded more than 25,000 births in both 2007 and 2008, the highest on record. By 2011, annual births had fallen below 23,000 and have stayed there since. Each year's kindergarten class reflects the smaller birth cohort five years earlier.
Two forces, one outcome
The inversion is not just about shrinking kindergarten. It is the collision of two separate forces: a birth rate that peaked and fell, and a high school retention rate that steadily improved.
Kindergarten enrollment grew 13.1% over the full 24-year span, from 17,844 in 2002 to 20,184 in 2026, but nearly all of that growth came before 2013. Since peaking at 22,537 that year, kindergarten has dropped by 2,353 students. The most recent three years have been especially weak: a 1,384-student drop in 2024, a partial recovery of 129 in 2025, and another 603-student decline in 2026.
Grade 12, by contrast, grew 43.7% over the same period, from 17,622 to 25,316. Part of that reflects larger cohorts entering high school, but part reflects a genuine improvement in how many students make it to graduation. In 2005, only 87.7% of a ninth grade cohort was still enrolled in 12th grade three years later. By 2026, that survival rate had climbed to 96.5%. Fewer students are leaving before senior year.
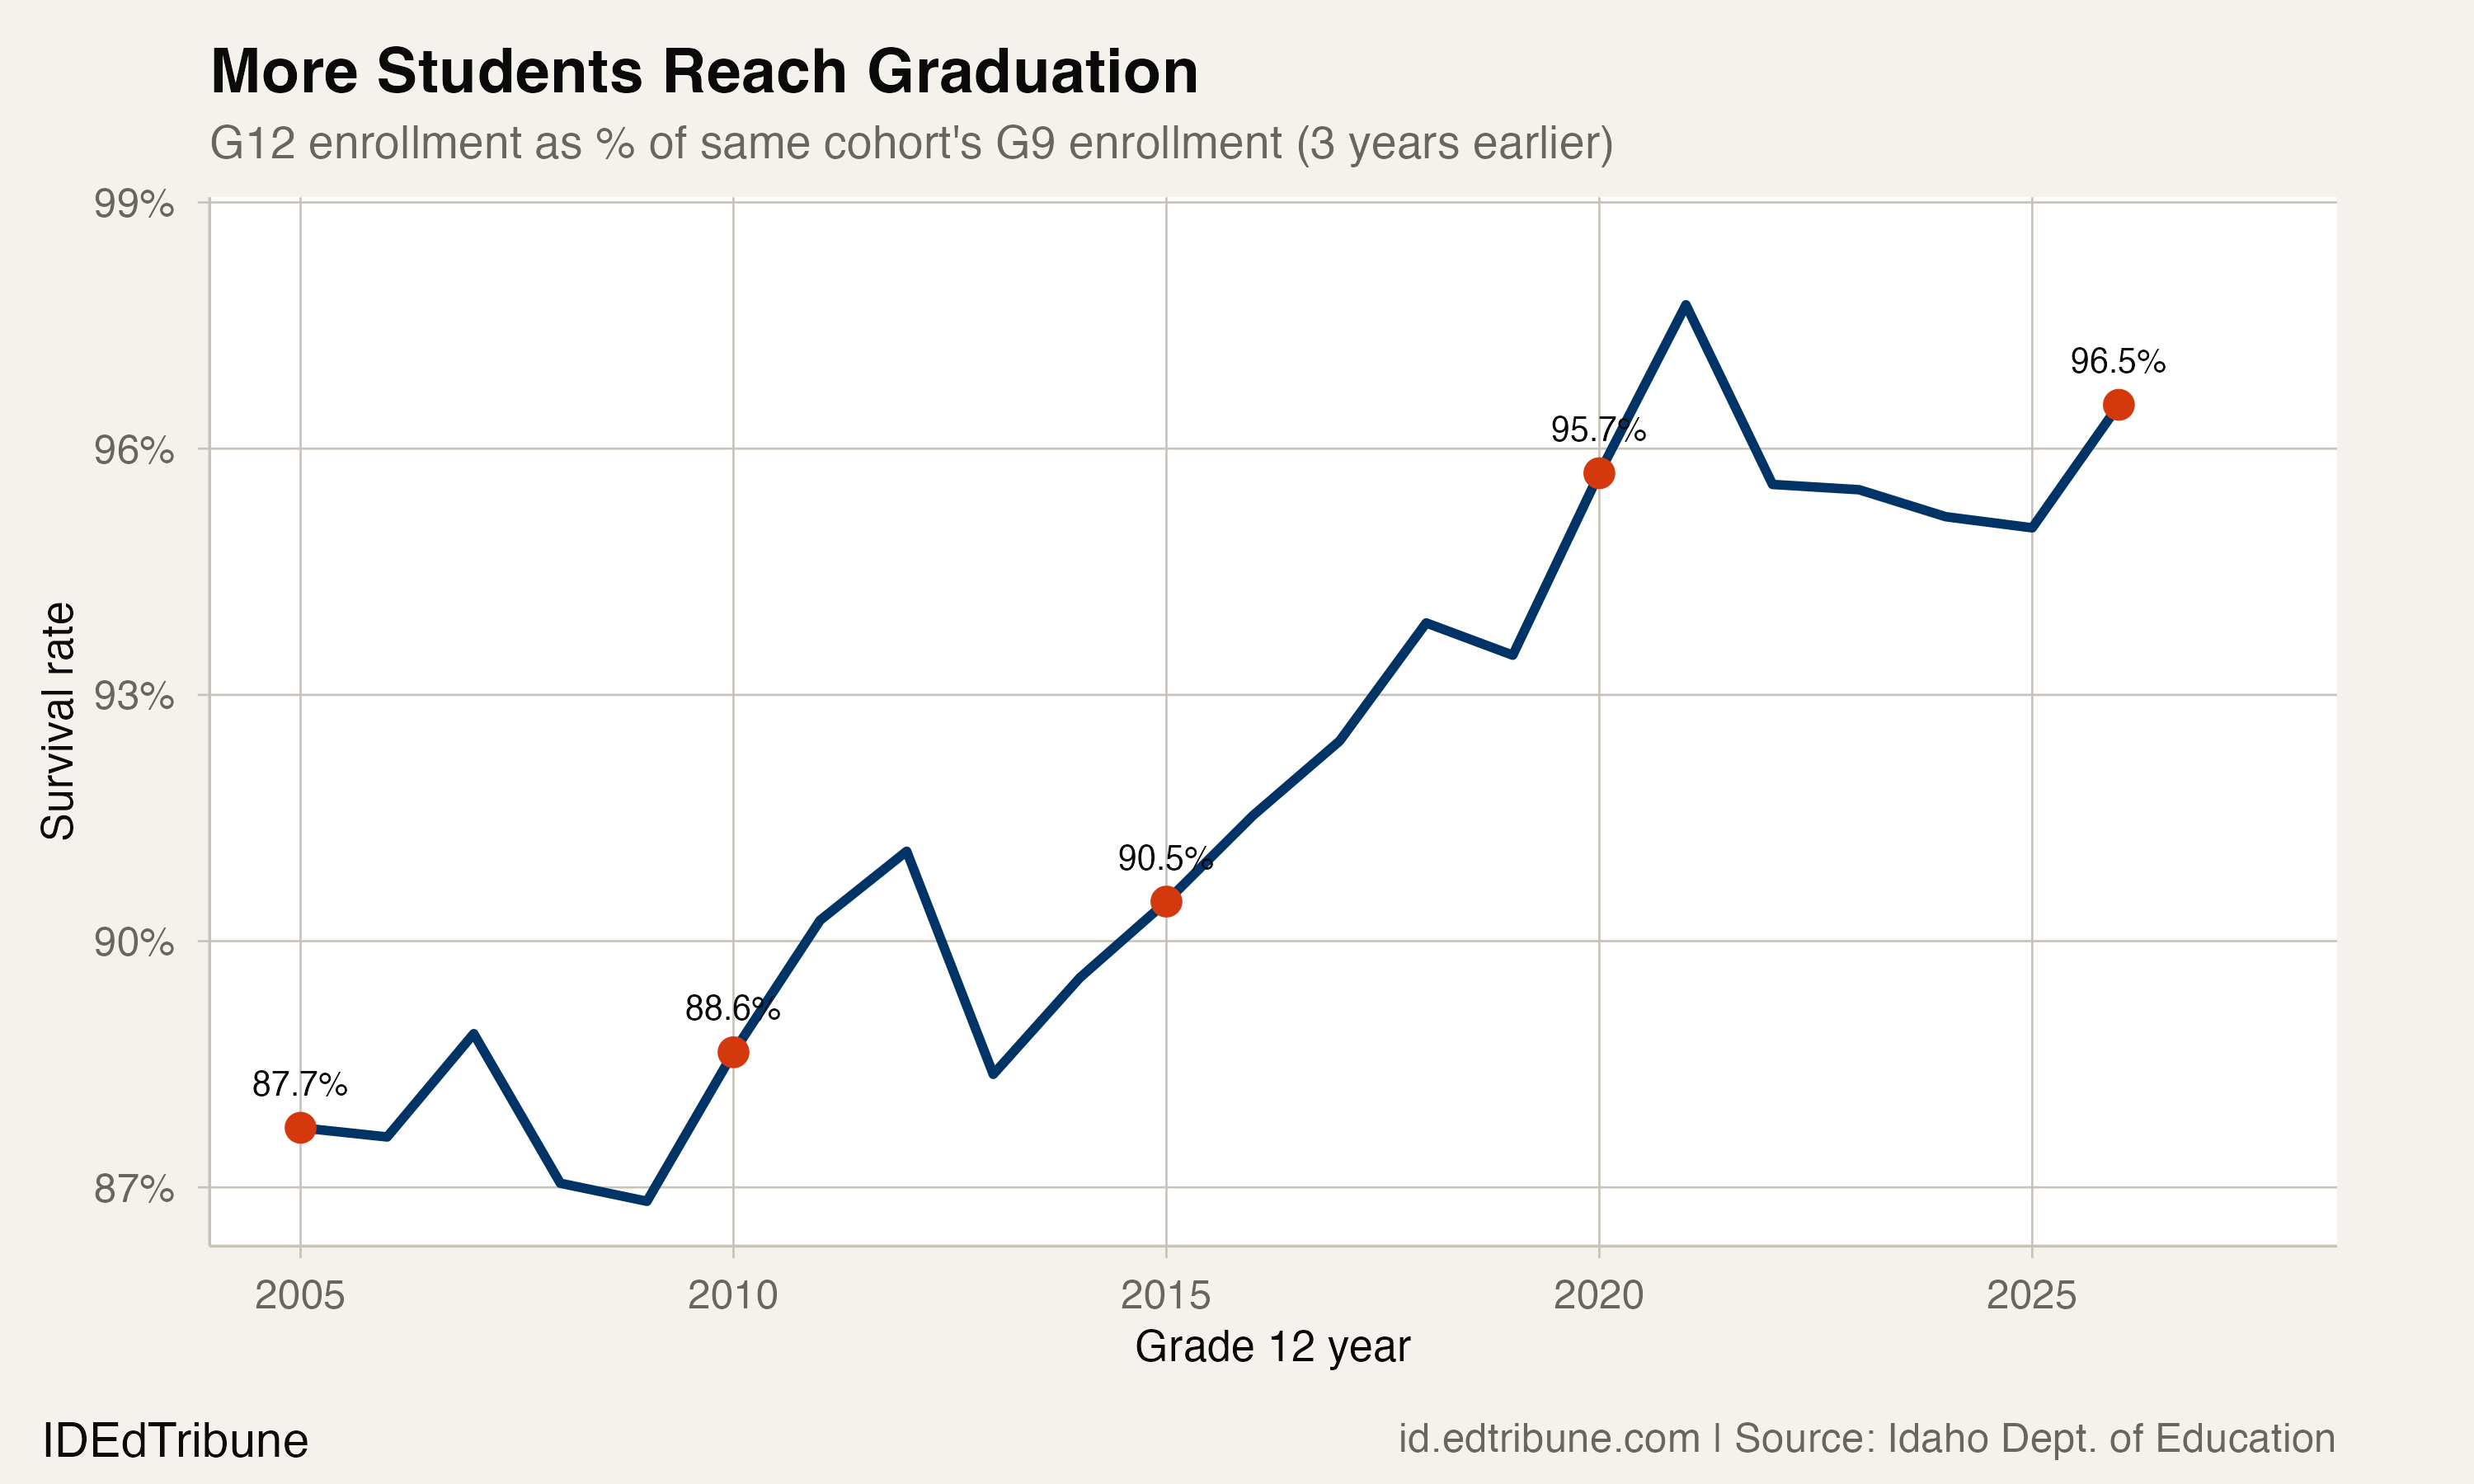
Idaho's four-year graduation rate hit a 10-year high of 82.3% in 2024, up from the mid-70s a decade earlier. The survival rate and the graduation rate measure different things: survival tracks whether students are still enrolled in 12th grade, while graduation tracks whether they receive a diploma that year. But both point in the same direction. More students are persisting through high school than at any point in the dataset.
What the pipeline tells the budget
The gap between kindergarten and grade 12 is not abstract. It is a preview of enrollment decline.
Idaho's K-12 enrollment peaked at 315,254 in 2023. It has since fallen 5,010 students to 310,244 in 2026, a 1.6% decline over three years. The pipeline makes clear this is just the beginning. Every grade from kindergarten through second is smaller than the grade above it, meaning as the large high school cohorts graduate out and smaller elementary cohorts move up, total enrollment will continue to fall even without any change in birth rates or migration.
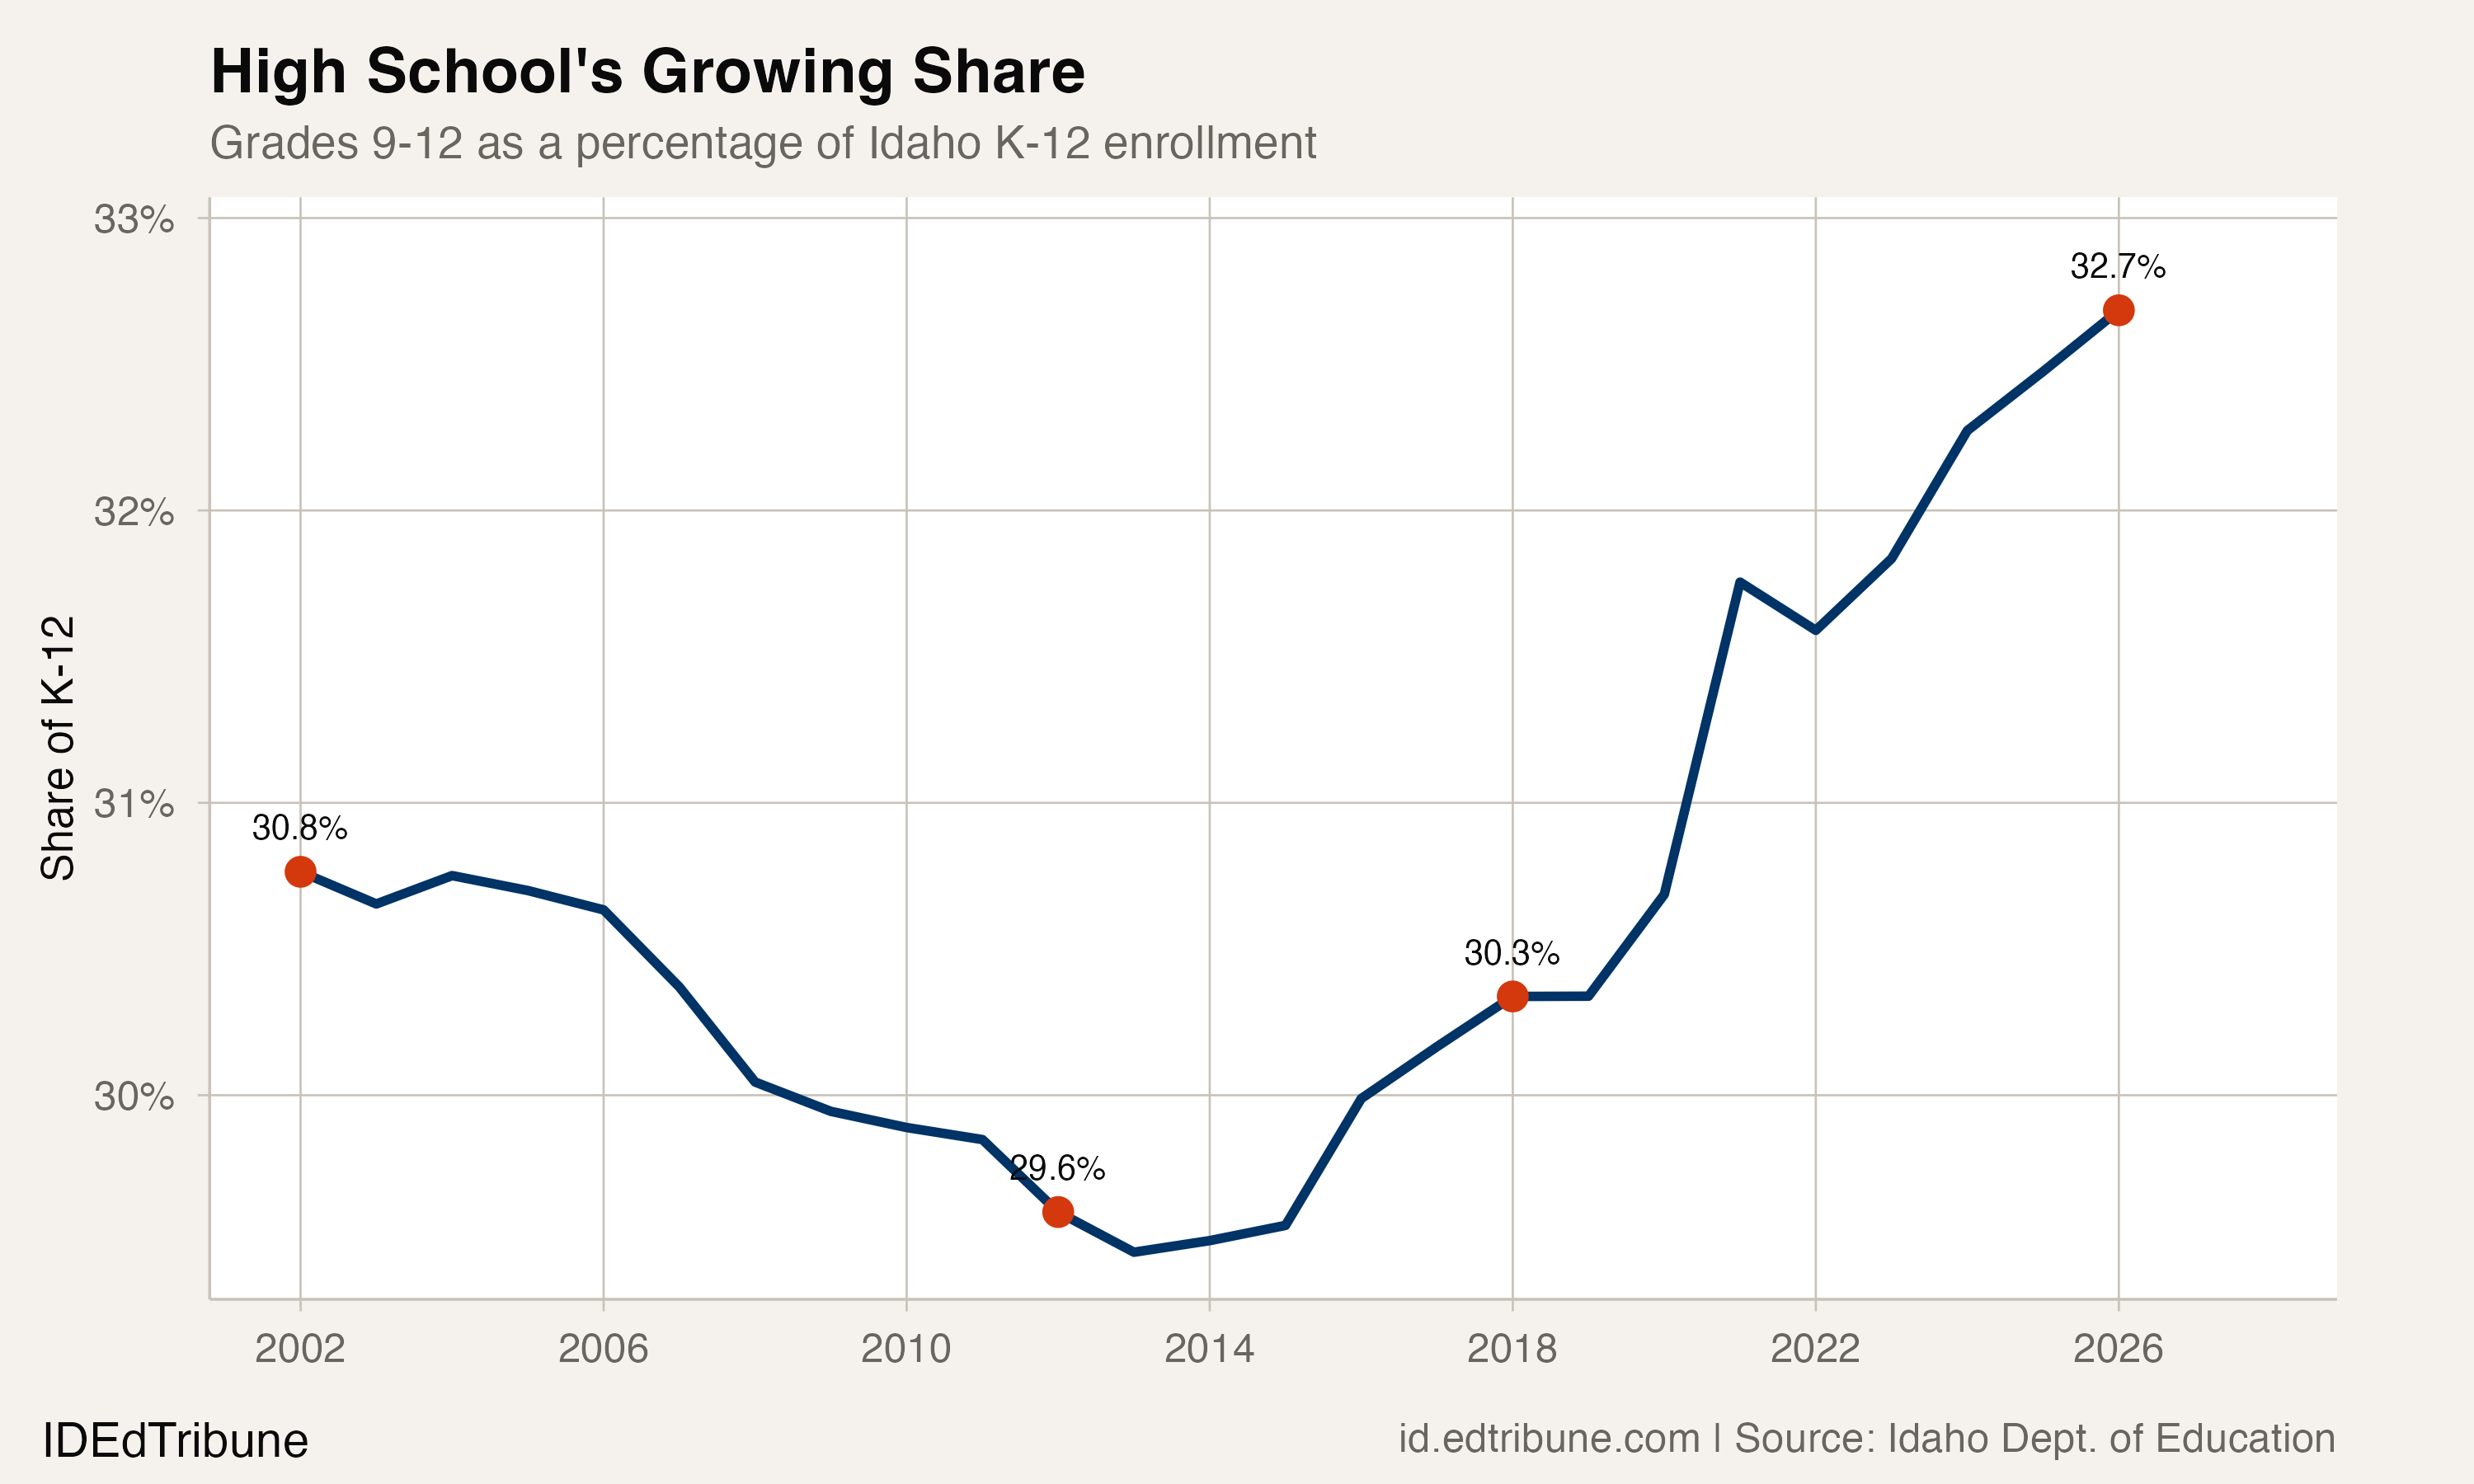
Grades 9-12 now account for 32.7% of Idaho's K-12 enrollment, up from 30.8% in 2002. In absolute terms, high school enrollment grew by 26,384 students over the period, more than either the K-5 band (+24,579) or the 6-8 band (+15,432), despite having fewer grade levels.
Idaho funds schools through an attendance-based formula that distributes dollars based on "support units," essentially the cost to operate a classroom. When enrollment drops, support units disappear, and with them the corresponding funding. The state Department of Education estimates schools will receive $24 million less through the formula this year alone because of declining headcounts.
"Even a flat budget is a cut." — State Superintendent Debbie Critchfield, Idaho Education News, Feb. 2026
That pressure will intensify. The current kindergarten class of 20,184 is the smallest since 2006. As it moves through the system, it will shrink every grade it enters relative to the cohort ahead of it. Barring a reversal in birth trends or a surge of in-migration with school-age children, Idaho's K-12 system will be managing a smaller student body for years to come.
The birth rate Idaho can't outgrow
Idaho's birth rate fell 29% between 2007 and 2021, from 16.6 to 11.8 births per 1,000 residents. That rate still exceeds neighboring Oregon (9.6), Montana (10.2), and Washington (10.8), but the direction is the same everywhere.
The state's rapid population growth has partially masked the birth decline. Idaho led the nation in child population growth from 2019 to 2022, but only 10% of the state's total population growth involved residents under 18. Many of Idaho's new arrivals are retirees, remote workers, or families whose children have already aged out of K-12. Population growth and enrollment growth have diverged.
Districts report another complicating factor since the pandemic: more families delaying kindergarten entry, with some of those students appearing in later grades. That may smooth individual year swings but does not change the underlying arithmetic. Fewer births mean fewer students, delayed by a year or not.
After the peak class graduates
The 2007-2008 birth peak cohort is in 12th grade now, the largest graduating class Idaho has ever seen. When 25,316 seniors walk in June, they will not be replaced by anything close to that number. The kindergarten class behind them is 20,184. Every class between is smaller than the one ahead of it.
Within two to three years, the ascending staircase will flatten, and the inversion will be visible across most of the grade span. State funding will follow it down: $24 million less this year, more the next. The demographic math was set when birth rates peaked in 2008. It just took 18 years to show up in the senior class totals.
Detailed code that reproduces the analysis and figures in this article is available exclusively to EdTribune subscribers.
Discussion
Sign in to join the discussion.
Loading comments...