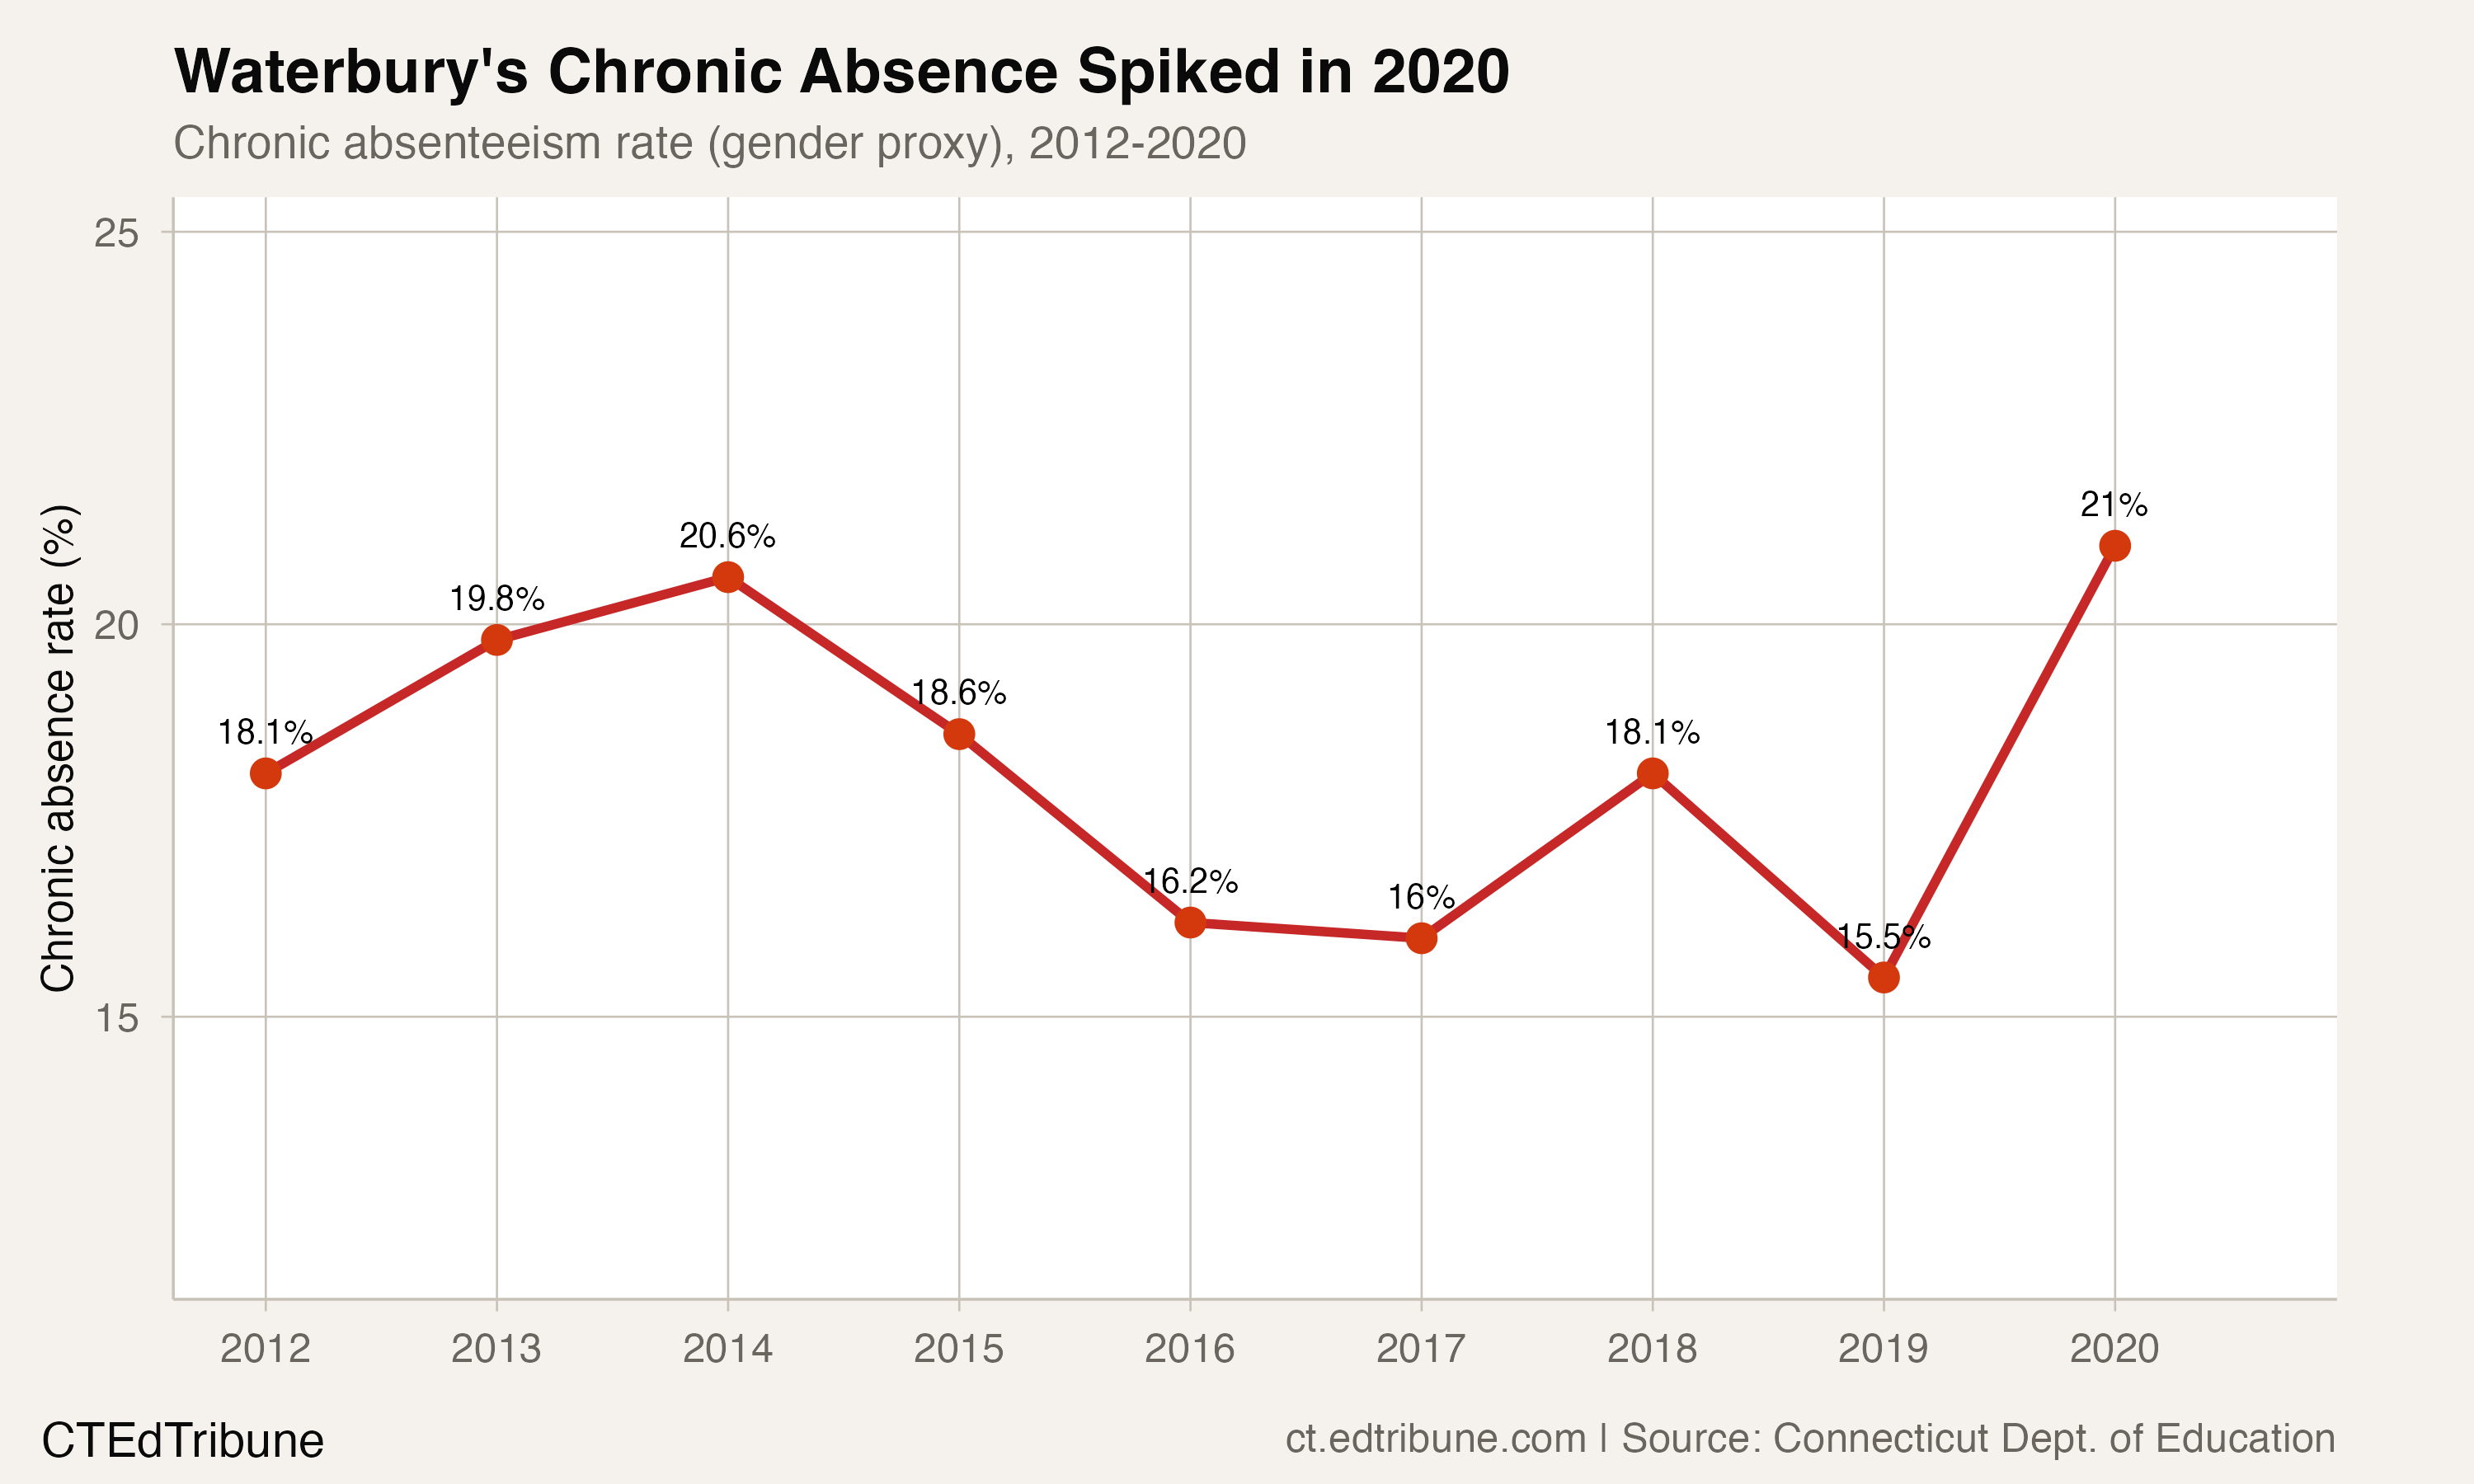
WaterburyET School District's chronic absenteeism trajectory looks like a seismograph. The rate swings 2 to 5 percentage points between consecutive years with no stable equilibrium — 18.1%, then 19.8%, then 20.6%, down to 16.2%, up to 18.1%, down to 15.5%, then the 2020 earthquake: a 5.5 percentage-point surge to 21.0%.
That jump — from the district's lowest point to its highest in a single year — was the largest among Connecticut's 15 major Alliance Districts. It came in a school year that was three months shorter than normal.
The spike in context
Among the 15 Alliance-type districts for which proxy or total data is available, Waterbury's 5.5-point jump from 2019 to 2020 was the largest. DanburyET followed at 3.8 points, Stamford at 2.9, and HartfordET at 2.5. Two districts — Windham and New BritainET — actually improved, with Meriden dropping 1.2 points.
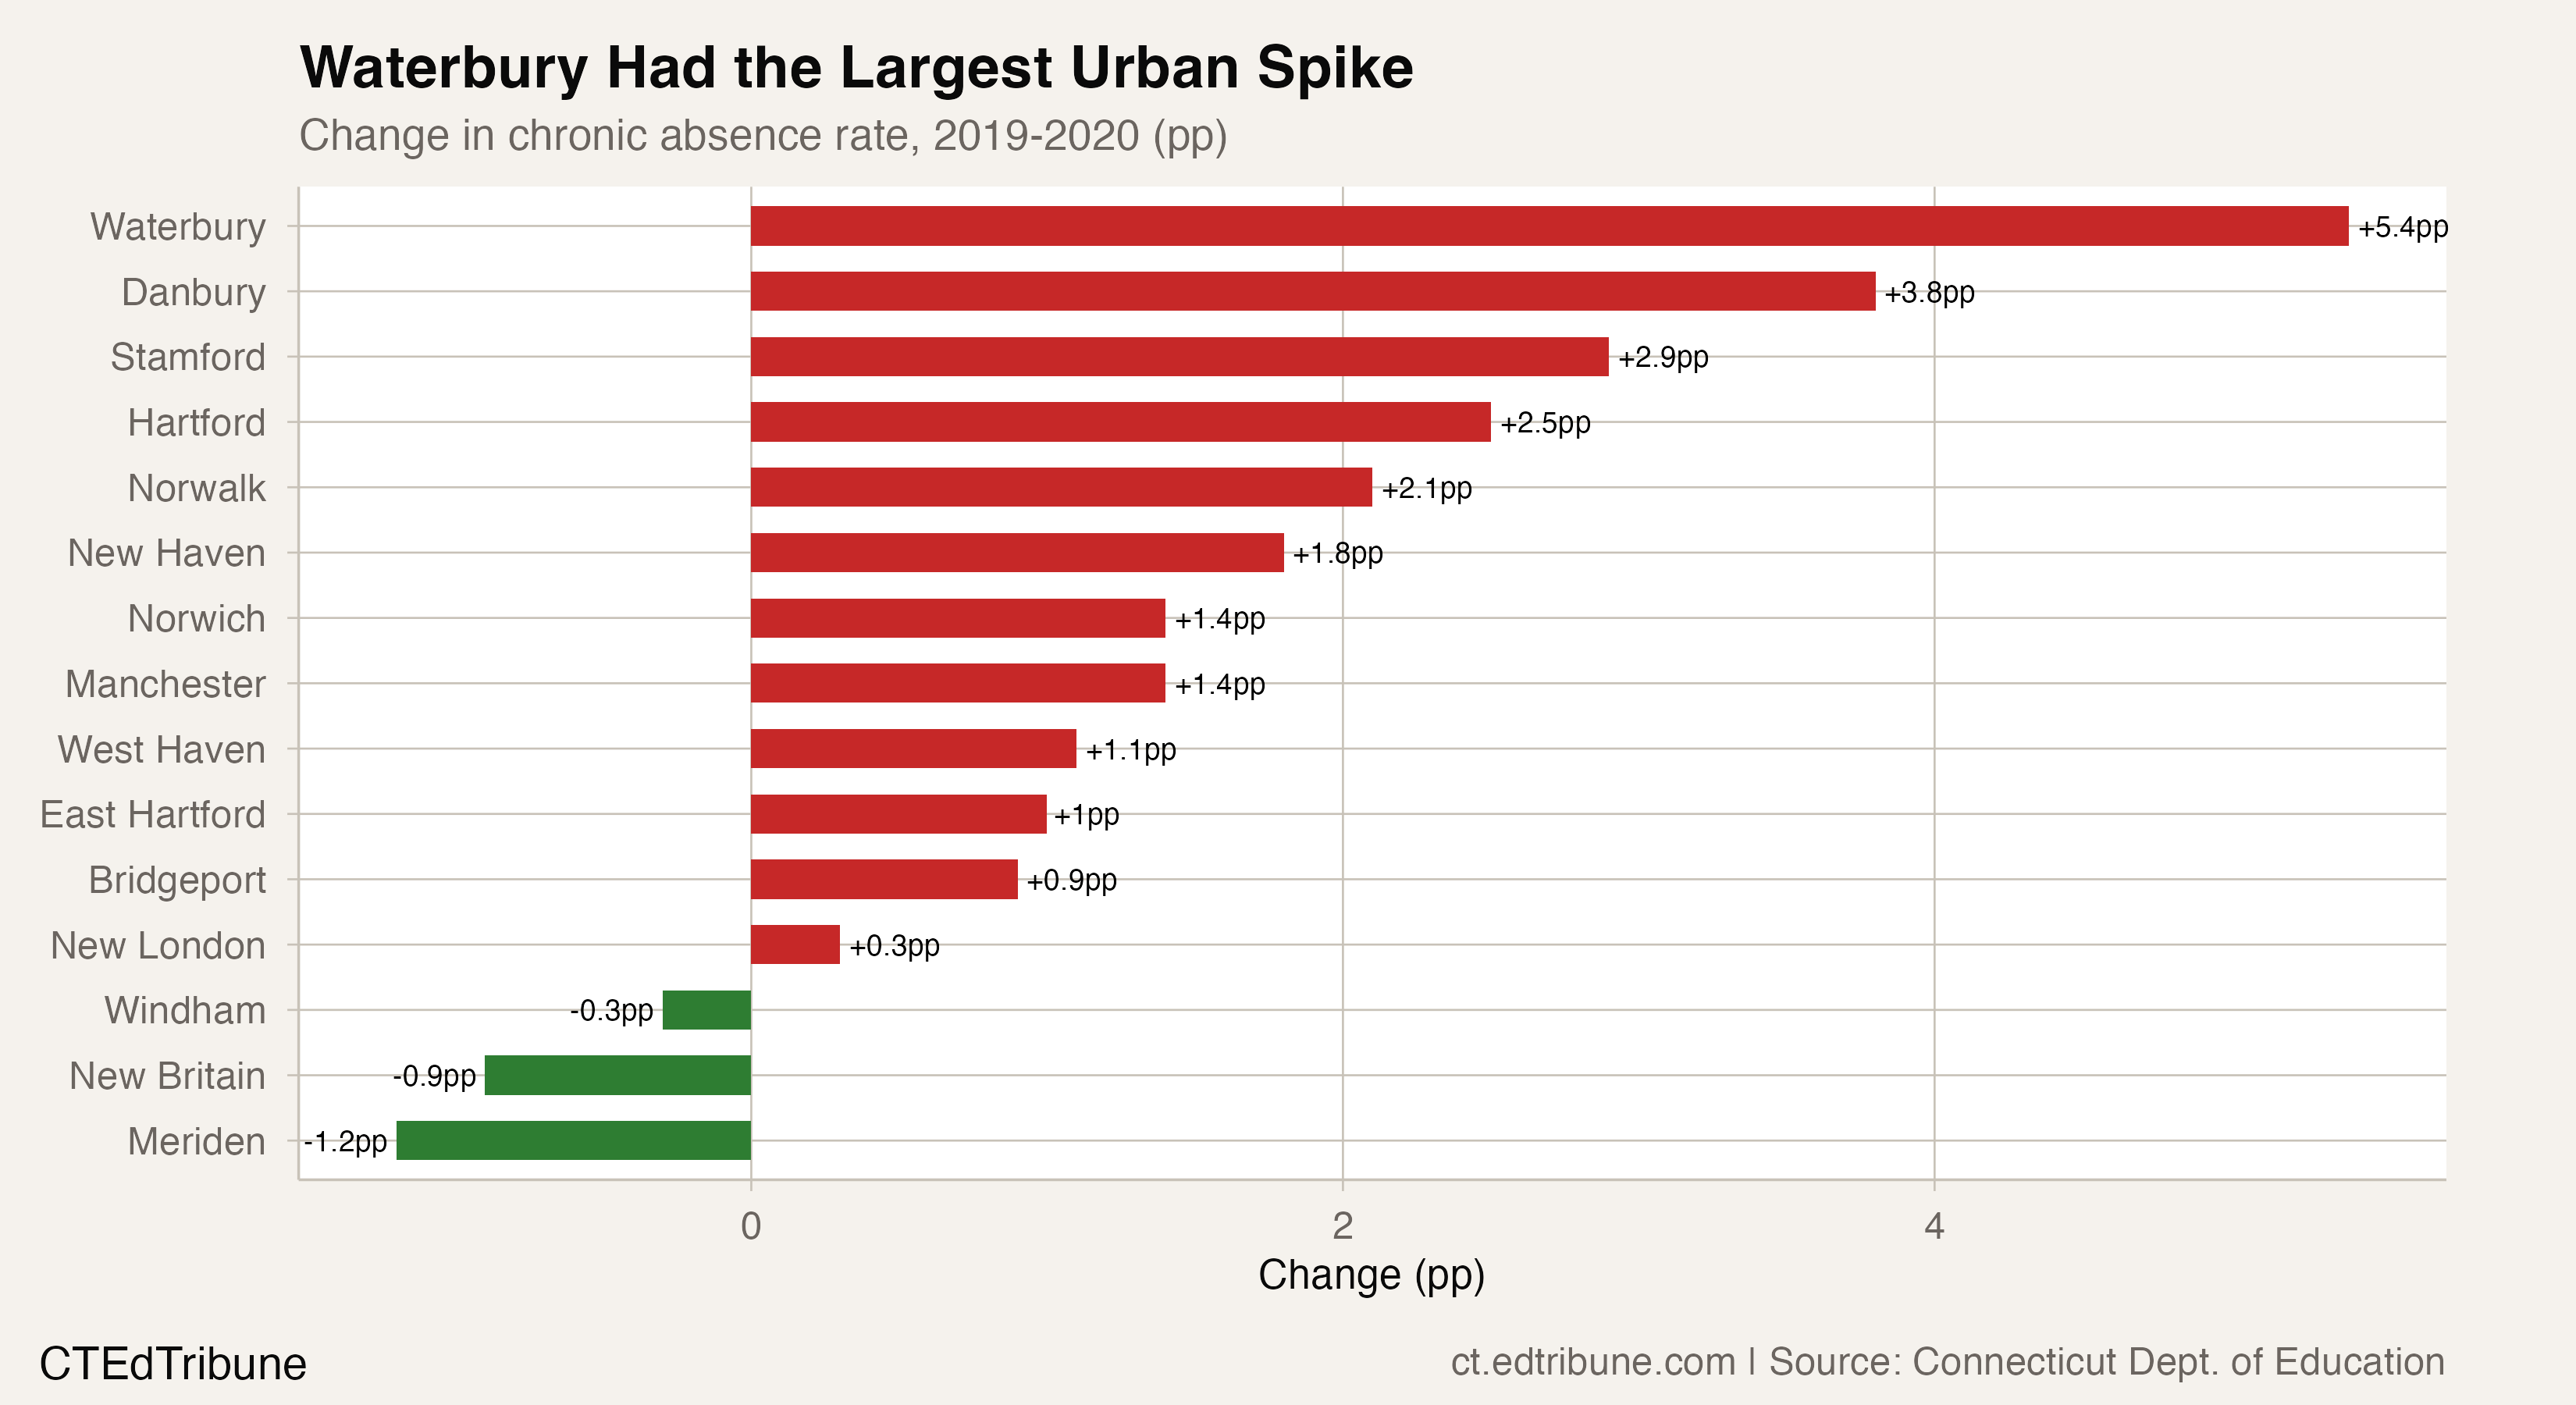
The variation is striking. All 15 districts faced the same three-month closure, the same pandemic uncertainty, the same state reporting framework. Yet their attendance responses ranged from a 5.5-point spike to a 1.2-point improvement. The factors that determine how a district's attendance responds to disruption are clearly local — not statewide.
A district that cannot find a floor
Waterbury's volatility is its defining feature. Over nine years of data, the standard deviation of its chronic absence rate was 2.0 percentage points — high for any district, and especially high for a large urban system that should have enough students to smooth out random variation.
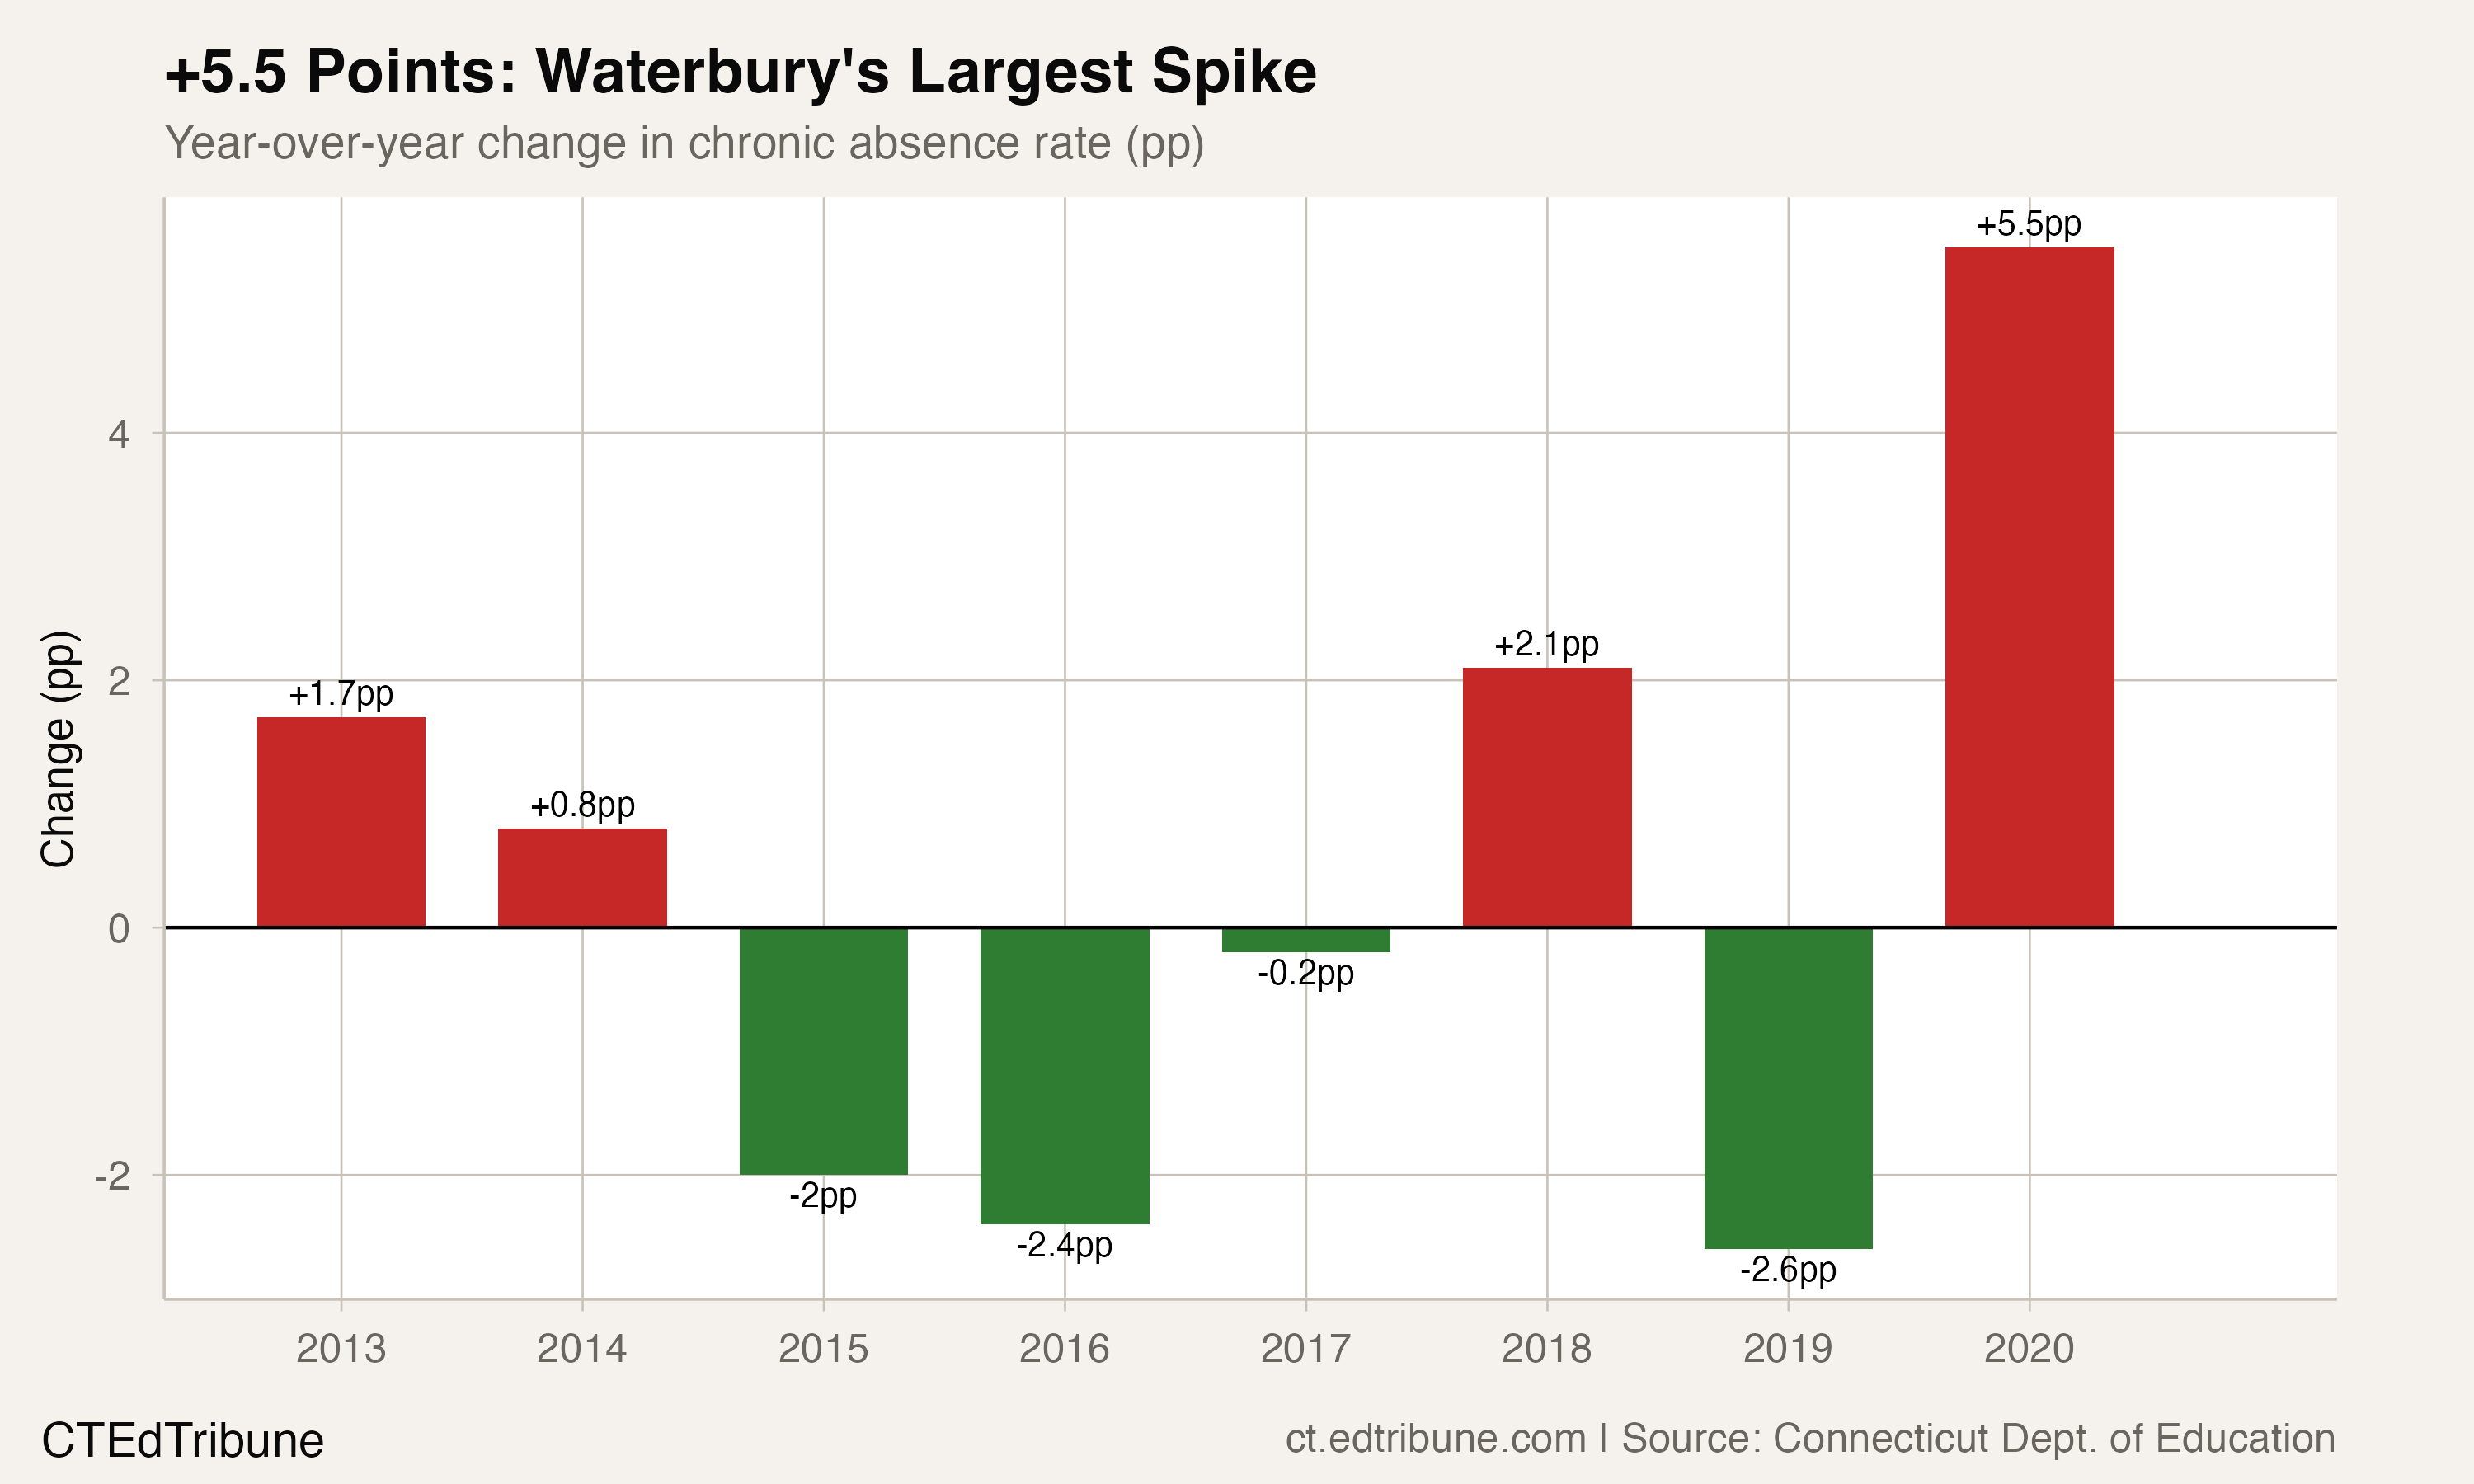
The pattern alternates between improvement and deterioration with a regularity that resists easy explanation. The district improved for three consecutive years from 2014 to 2016 (20.6% to 16.2%), worsened in 2018 (18.1%), improved sharply in 2019 (15.5%), then spiked to its worst level in 2020. No other large district in the dataset displays this kind of oscillation.
The 15.5% rate in 2019 looked like a breakthrough — Waterbury's lowest chronic absence rate on record. But the 2020 spike erased not just that progress but the entire trajectory of improvement since 2014. The pattern suggests that whatever drives improvement in Waterbury is fragile: gains can be reversed completely in a single year.
Waterbury closed the gap on Hartford
In 2012, Waterbury's proxy rate of 18.1% was 7.9 points below Hartford's 26.0%. By 2020, the gap had shrunk to 6.9 points — Waterbury at 21.0%, Hartford at 27.9%. The convergence accelerated in 2020: Waterbury jumped 5.5 points while Hartford rose 2.5.
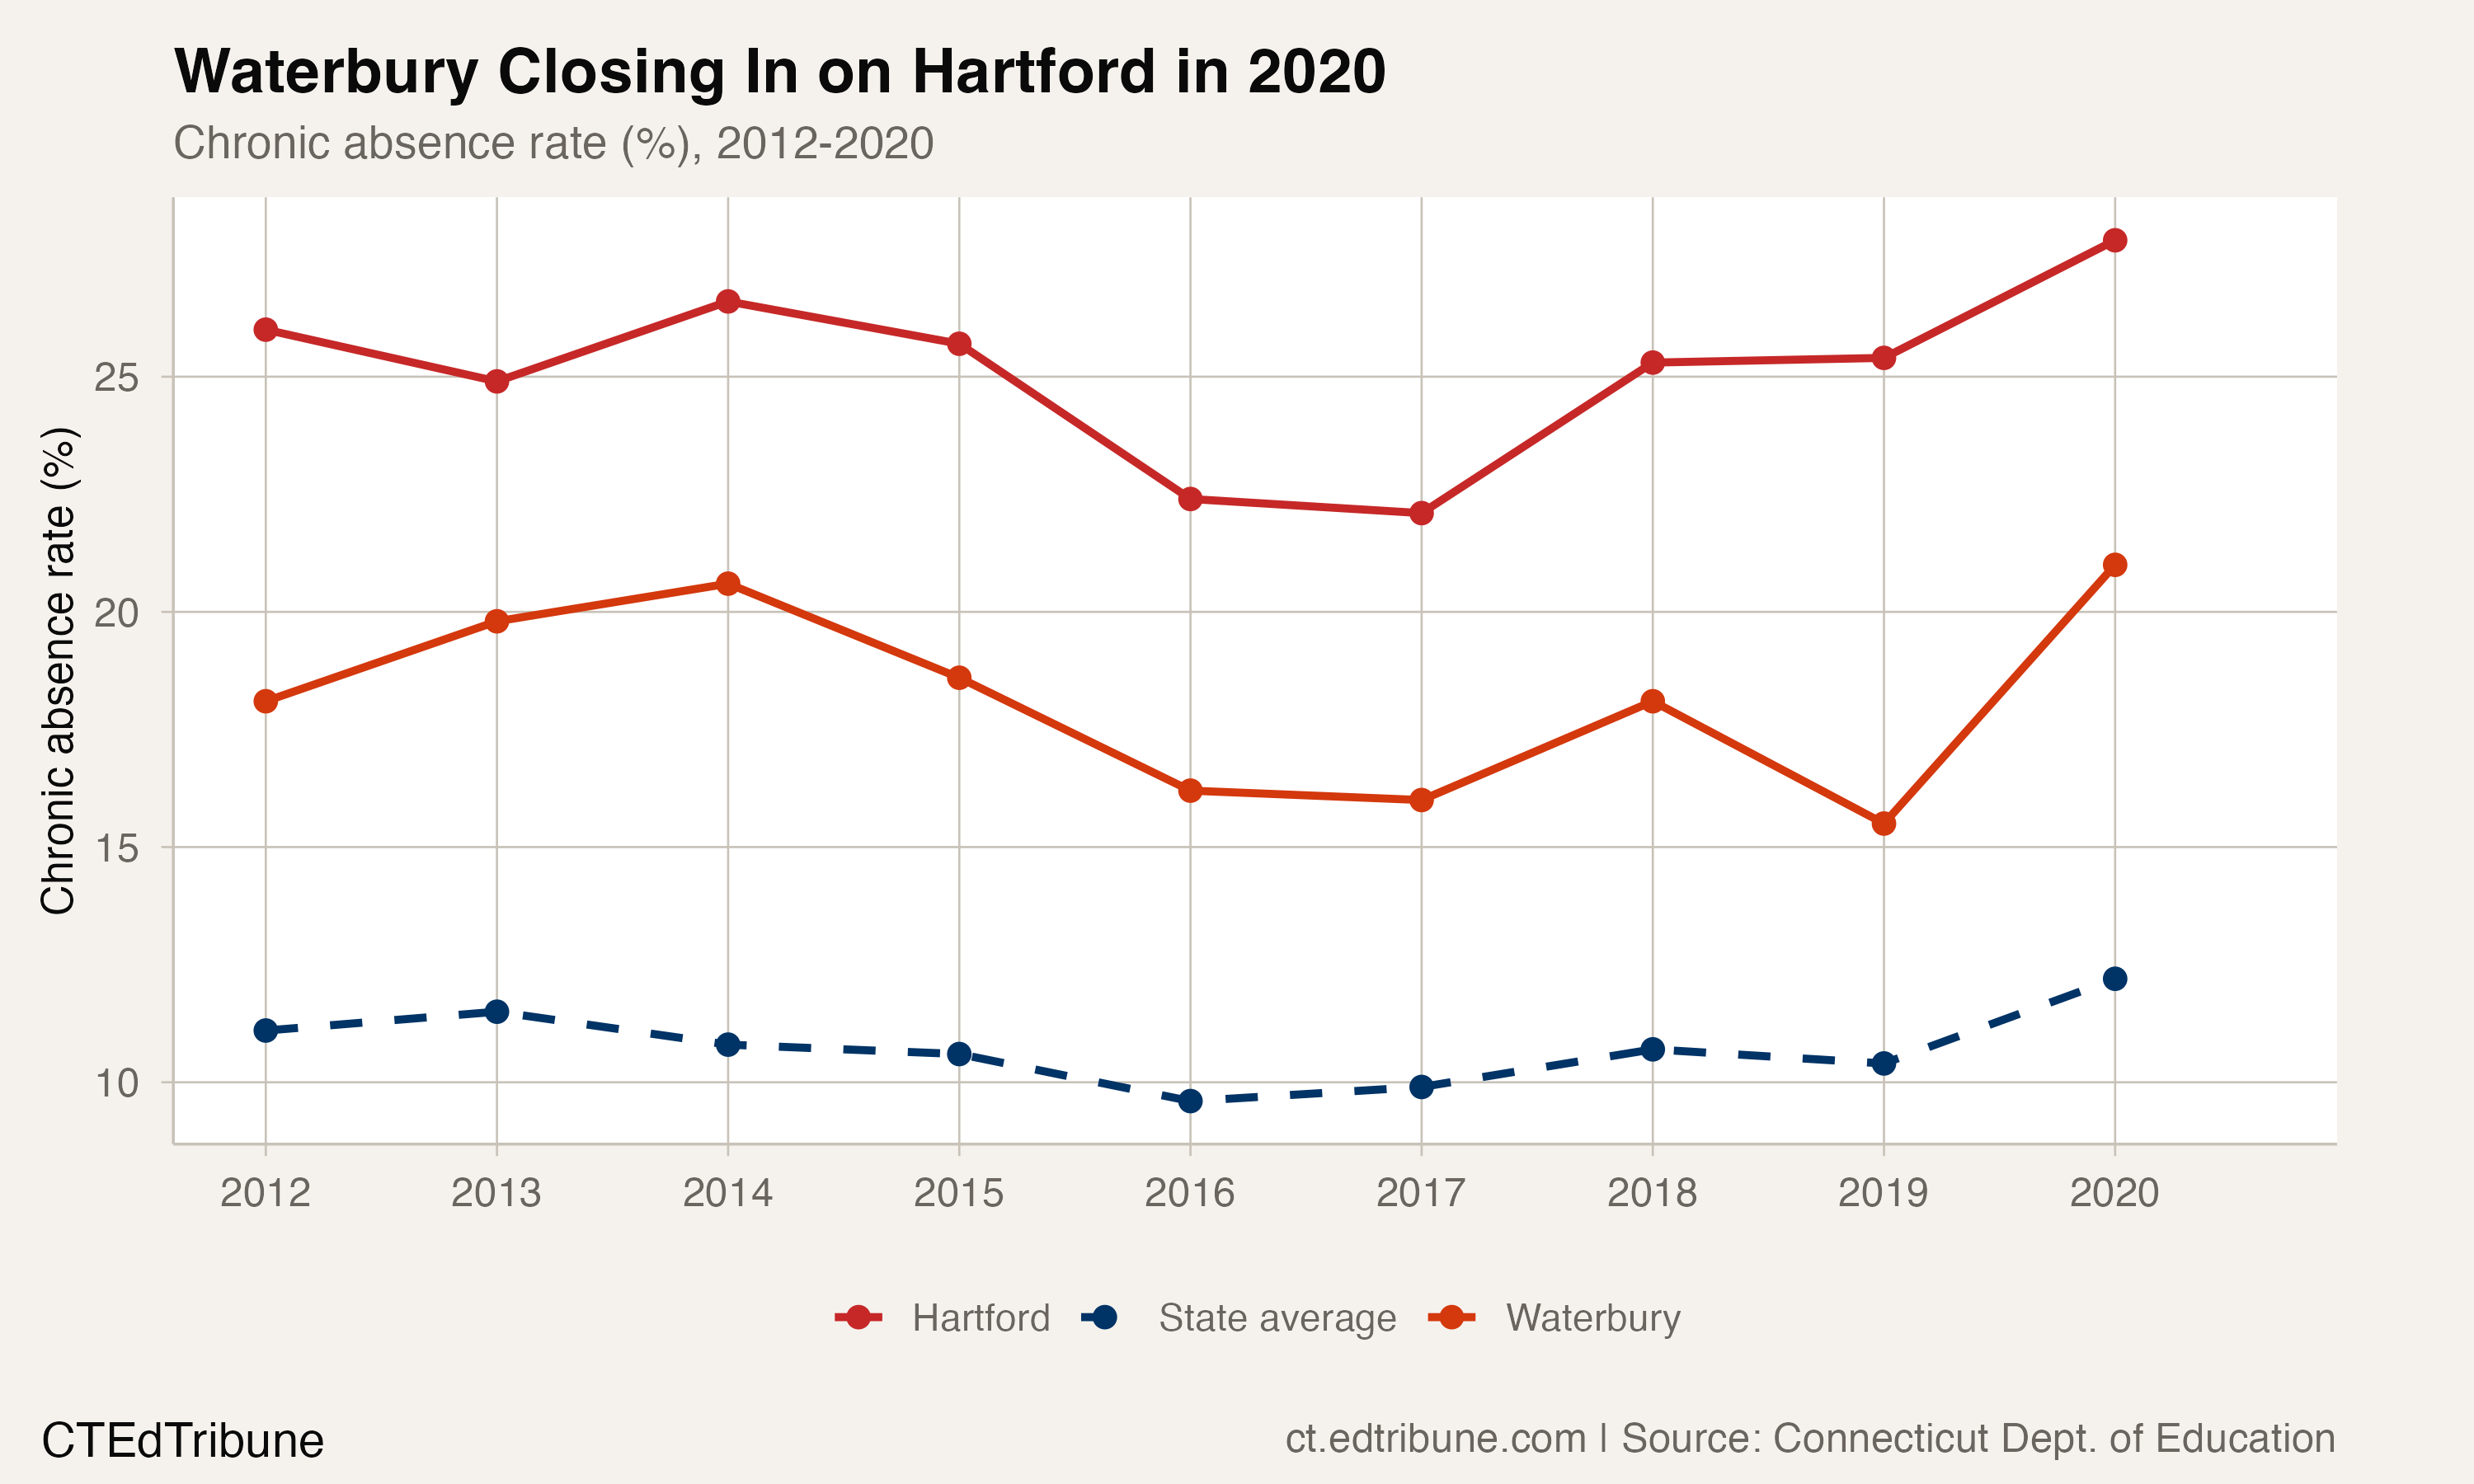
The convergence is not a good-news story. Waterbury was not catching up because Hartford improved. Both districts were getting worse, with Waterbury worsening faster. If the trend continued through the post-COVID spike — web research shows Waterbury peaked at 39.5% in 2021-22 before declining to 25.8% by 2024-25 — the two cities may have briefly reached near-parity at the peak of the crisis.
LEAP at four schools, 26% district-wide
The Waterbury Board of Education reported in January 2025 that the district's chronic absenteeism rate stood at approximately 26% at the 77th day of the school year — still above the pre-COVID peak of 21.0% in the available data. The district runs LEAP at four schools and has deployed layered intervention strategies: chronic absenteeism teams (CAT teams) at every school, nudge letters, home visits, and referrals to community services.
The district described kindergarten chronic absenteeism as a "particular monitoring goal" and reported that Hispanic students and students with individualized education programs make up a disproportionate share of the chronically absent population. — Waterbury Board of Education presentation, January 2025
The LEAP grant of $534,650 from ARPA-funded state allocations pays for coordinators, team leaders, and engagement specialists who make the home visits that form the program's core. But ARPA funds have an expiration date, and the question for Waterbury — as for every district relying on pandemic recovery funding — is whether the intervention infrastructure can survive the transition to sustainable state funding.
The pre-COVID signal was clear
The pre-COVID data delivers an uncomfortable message for Waterbury. Even at its 2019 low of 15.5%, the district's chronic absence rate was 50% above the statewide average of 10.4%. The volatility — the inability to sustain improvement from one year to the next — suggests that the district's attendance challenges are structural rather than cyclical.
Connecticut's truancy law (Public Act 15-225) requires schools to file truancy reports after a student misses four days in a month or 10 days in a year. But in Waterbury, the challenge is not identifying absent students. It is building systems that produce stable improvement -- a good year that leads to another good year, instead of a good year followed by a reversal that wipes out the progress entirely.
Nine years of data. Not one sustained improvement streak longer than three years. Then the pandemic hit, and the 5.5-point spike made the volatility look like stability by comparison.
Detailed code that reproduces the analysis and figures in this article is available exclusively to EdTribune subscribers.
Discussion
Sign in to join the discussion.
Loading comments...