Correction (April 18, 2026): An earlier version of this article described a 2023-24 enrollment "spike" of 18,643 students. That figure reflected a reporting artifact in the state's TOTAL enrollment row, which undercounted students by 16,000 to 19,500 from 2020 through 2023 due to the EdSight unification process. When the discrepancy was corrected in the 2024 data, the TOTAL row appeared to jump, but the sum of individual grade-level counts actually declined by 862 that year. The year-over-year narrative, COVID loss figures, and "reprieve that wasn't" section have been rewritten with corrected numbers. The headline thesis and endpoint totals (564,499 in 2011, 497,760 in 2026) were not affected.
Connecticut's public school enrollment has fallen in nearly every year since 2012. In 2025-26, the decline accelerated sharply: the state lost 10,640 students, landing at 497,760. That is the largest single-year decline outside of the COVID-19 pandemic since at least 2007, and it pushed the state below 500,000 public school students for the first time in more than two decades.
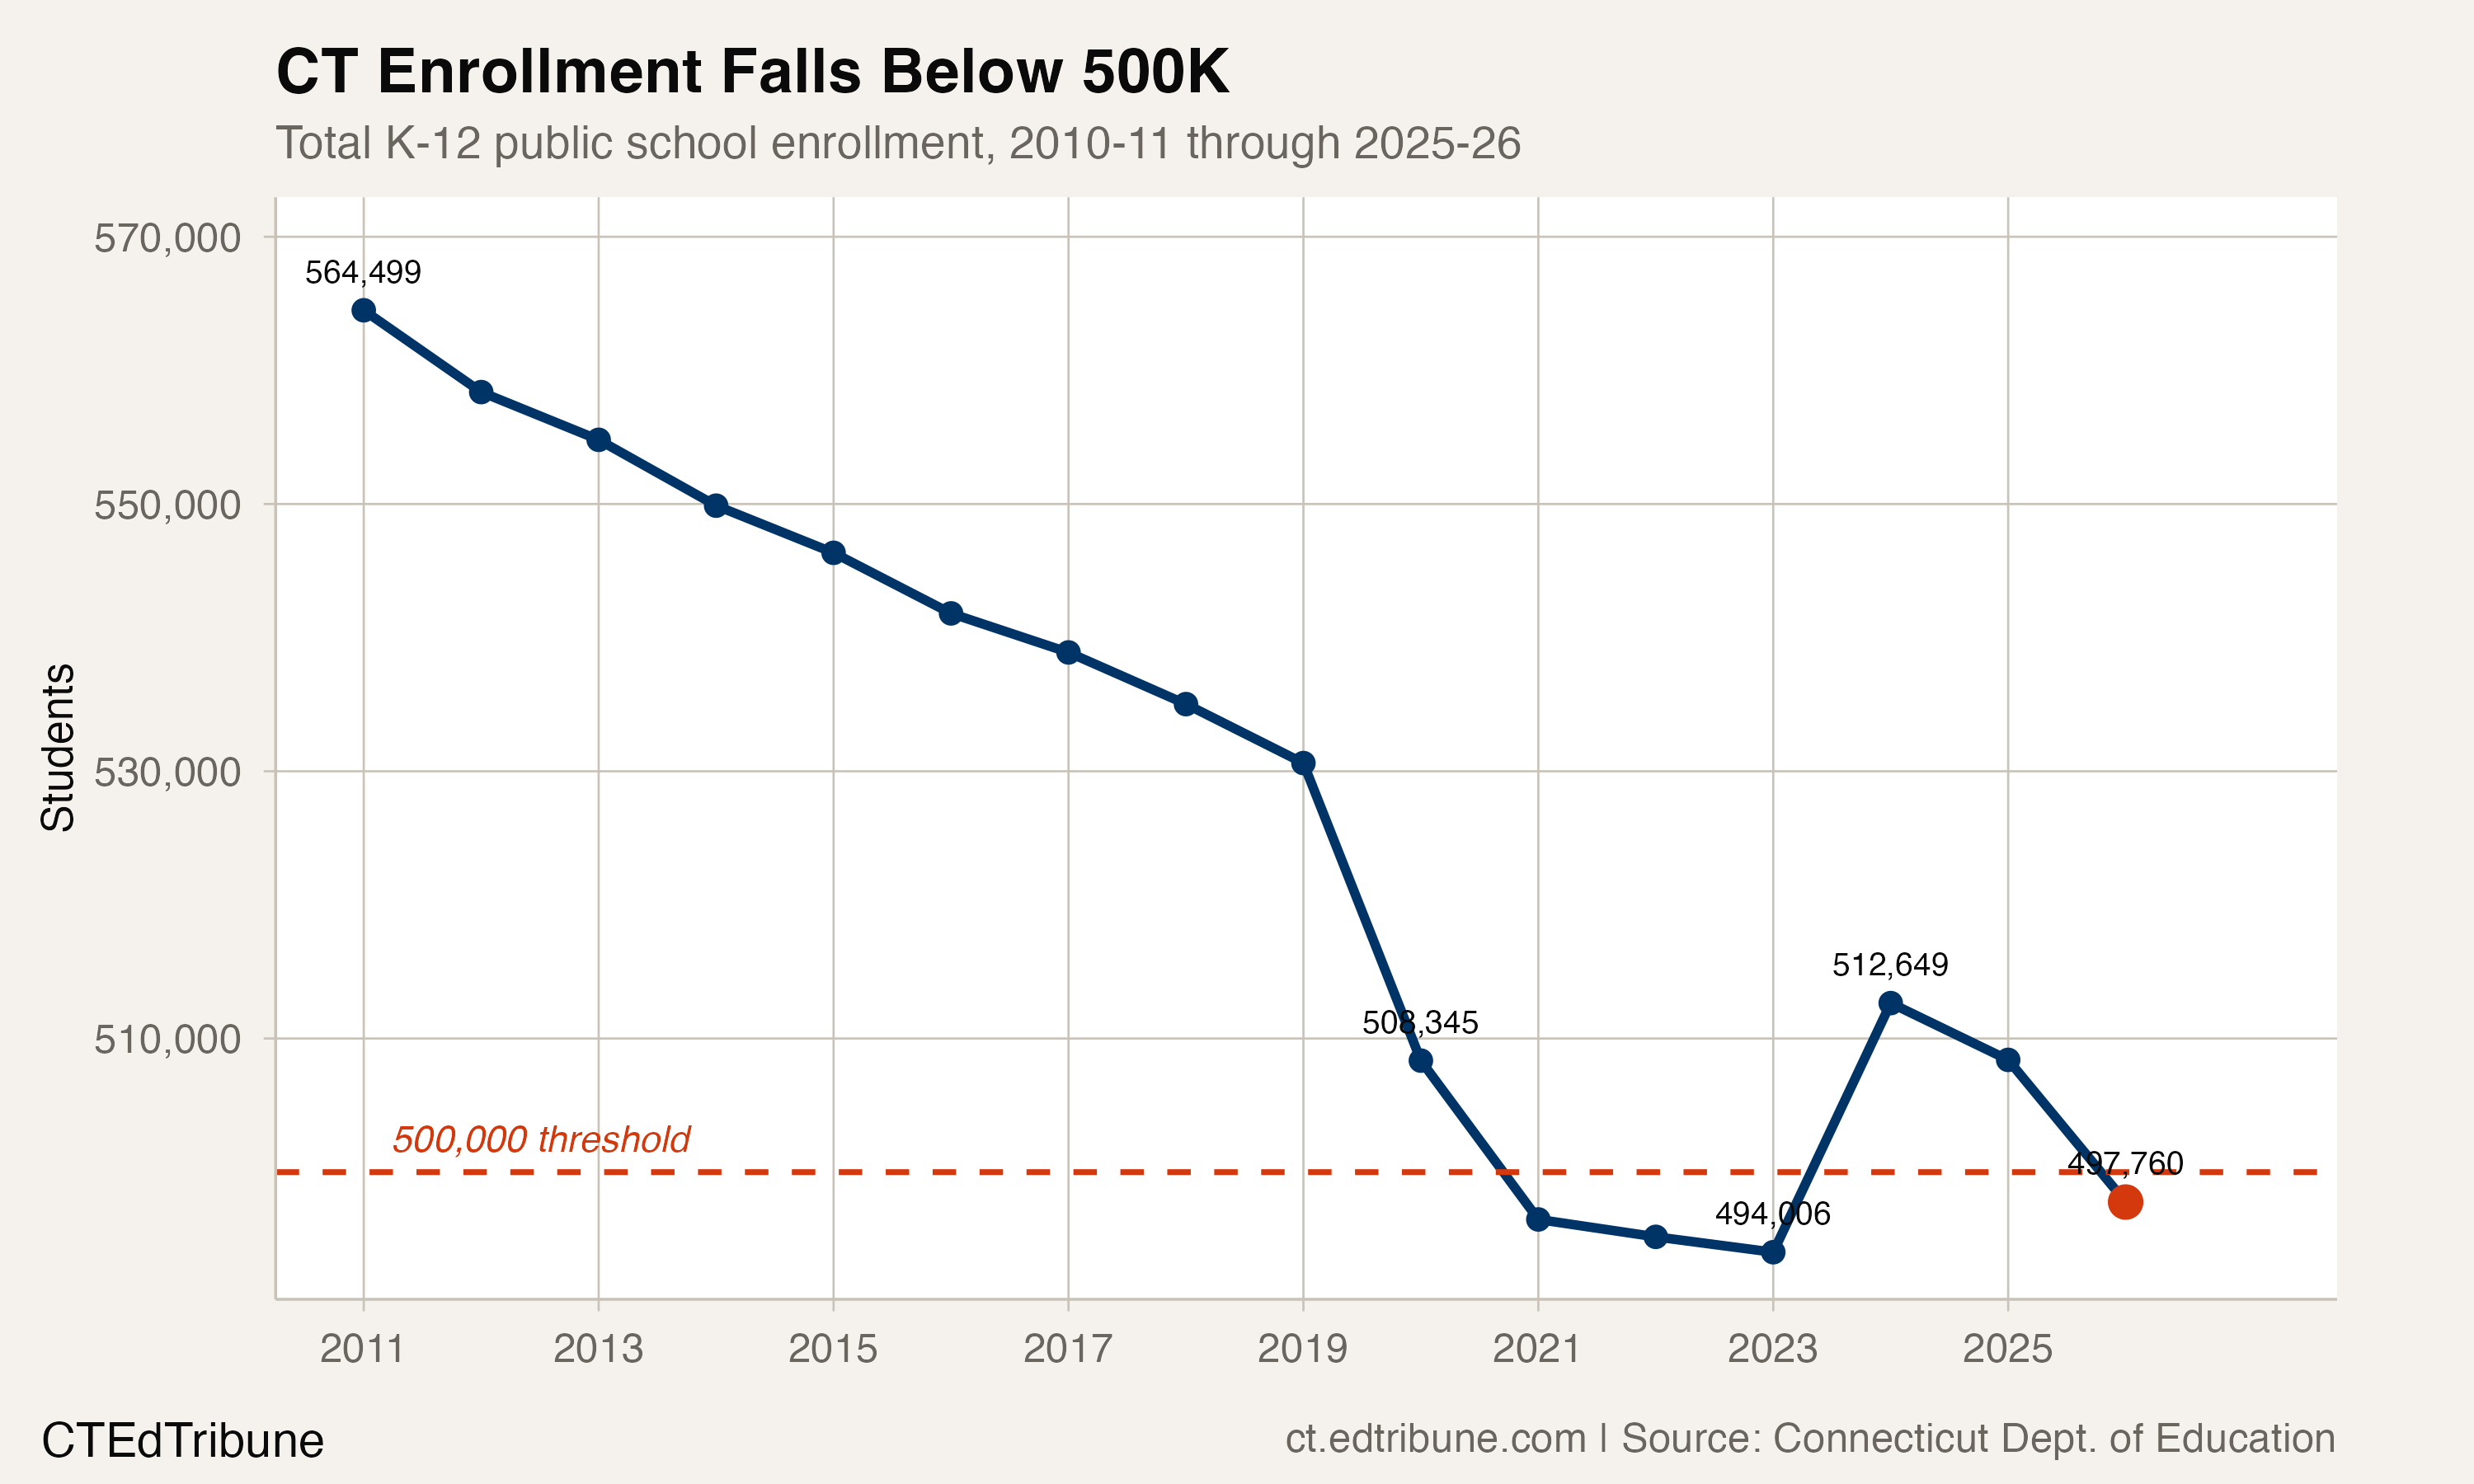
Fifteen years, 66,739 students
The scale of loss is hard to absorb in annual increments. Connecticut enrolled 564,499 students in 2010-11. Fifteen years later, 66,739 of those seats are empty, an 11.8% decline. The pre-COVID era alone erased 33,888 students at an average of about 4,200 per year. COVID then delivered two blows: 2,782 students disappeared from rosters in 2019-20, followed by a much larger loss of 14,752 in 2020-21, the single worst year in the dataset.
What came next was a brief plateau, not a recovery. Enrollment ticked up by 536 in 2021-22, essentially held flat with a loss of just 102 in 2022-23, then resumed falling: down 862 in 2023-24, 4,249 in 2024-25, and 10,640 in 2025-26. The post-COVID stability was real but shallow, and it gave way to the steepest non-pandemic decline on record.
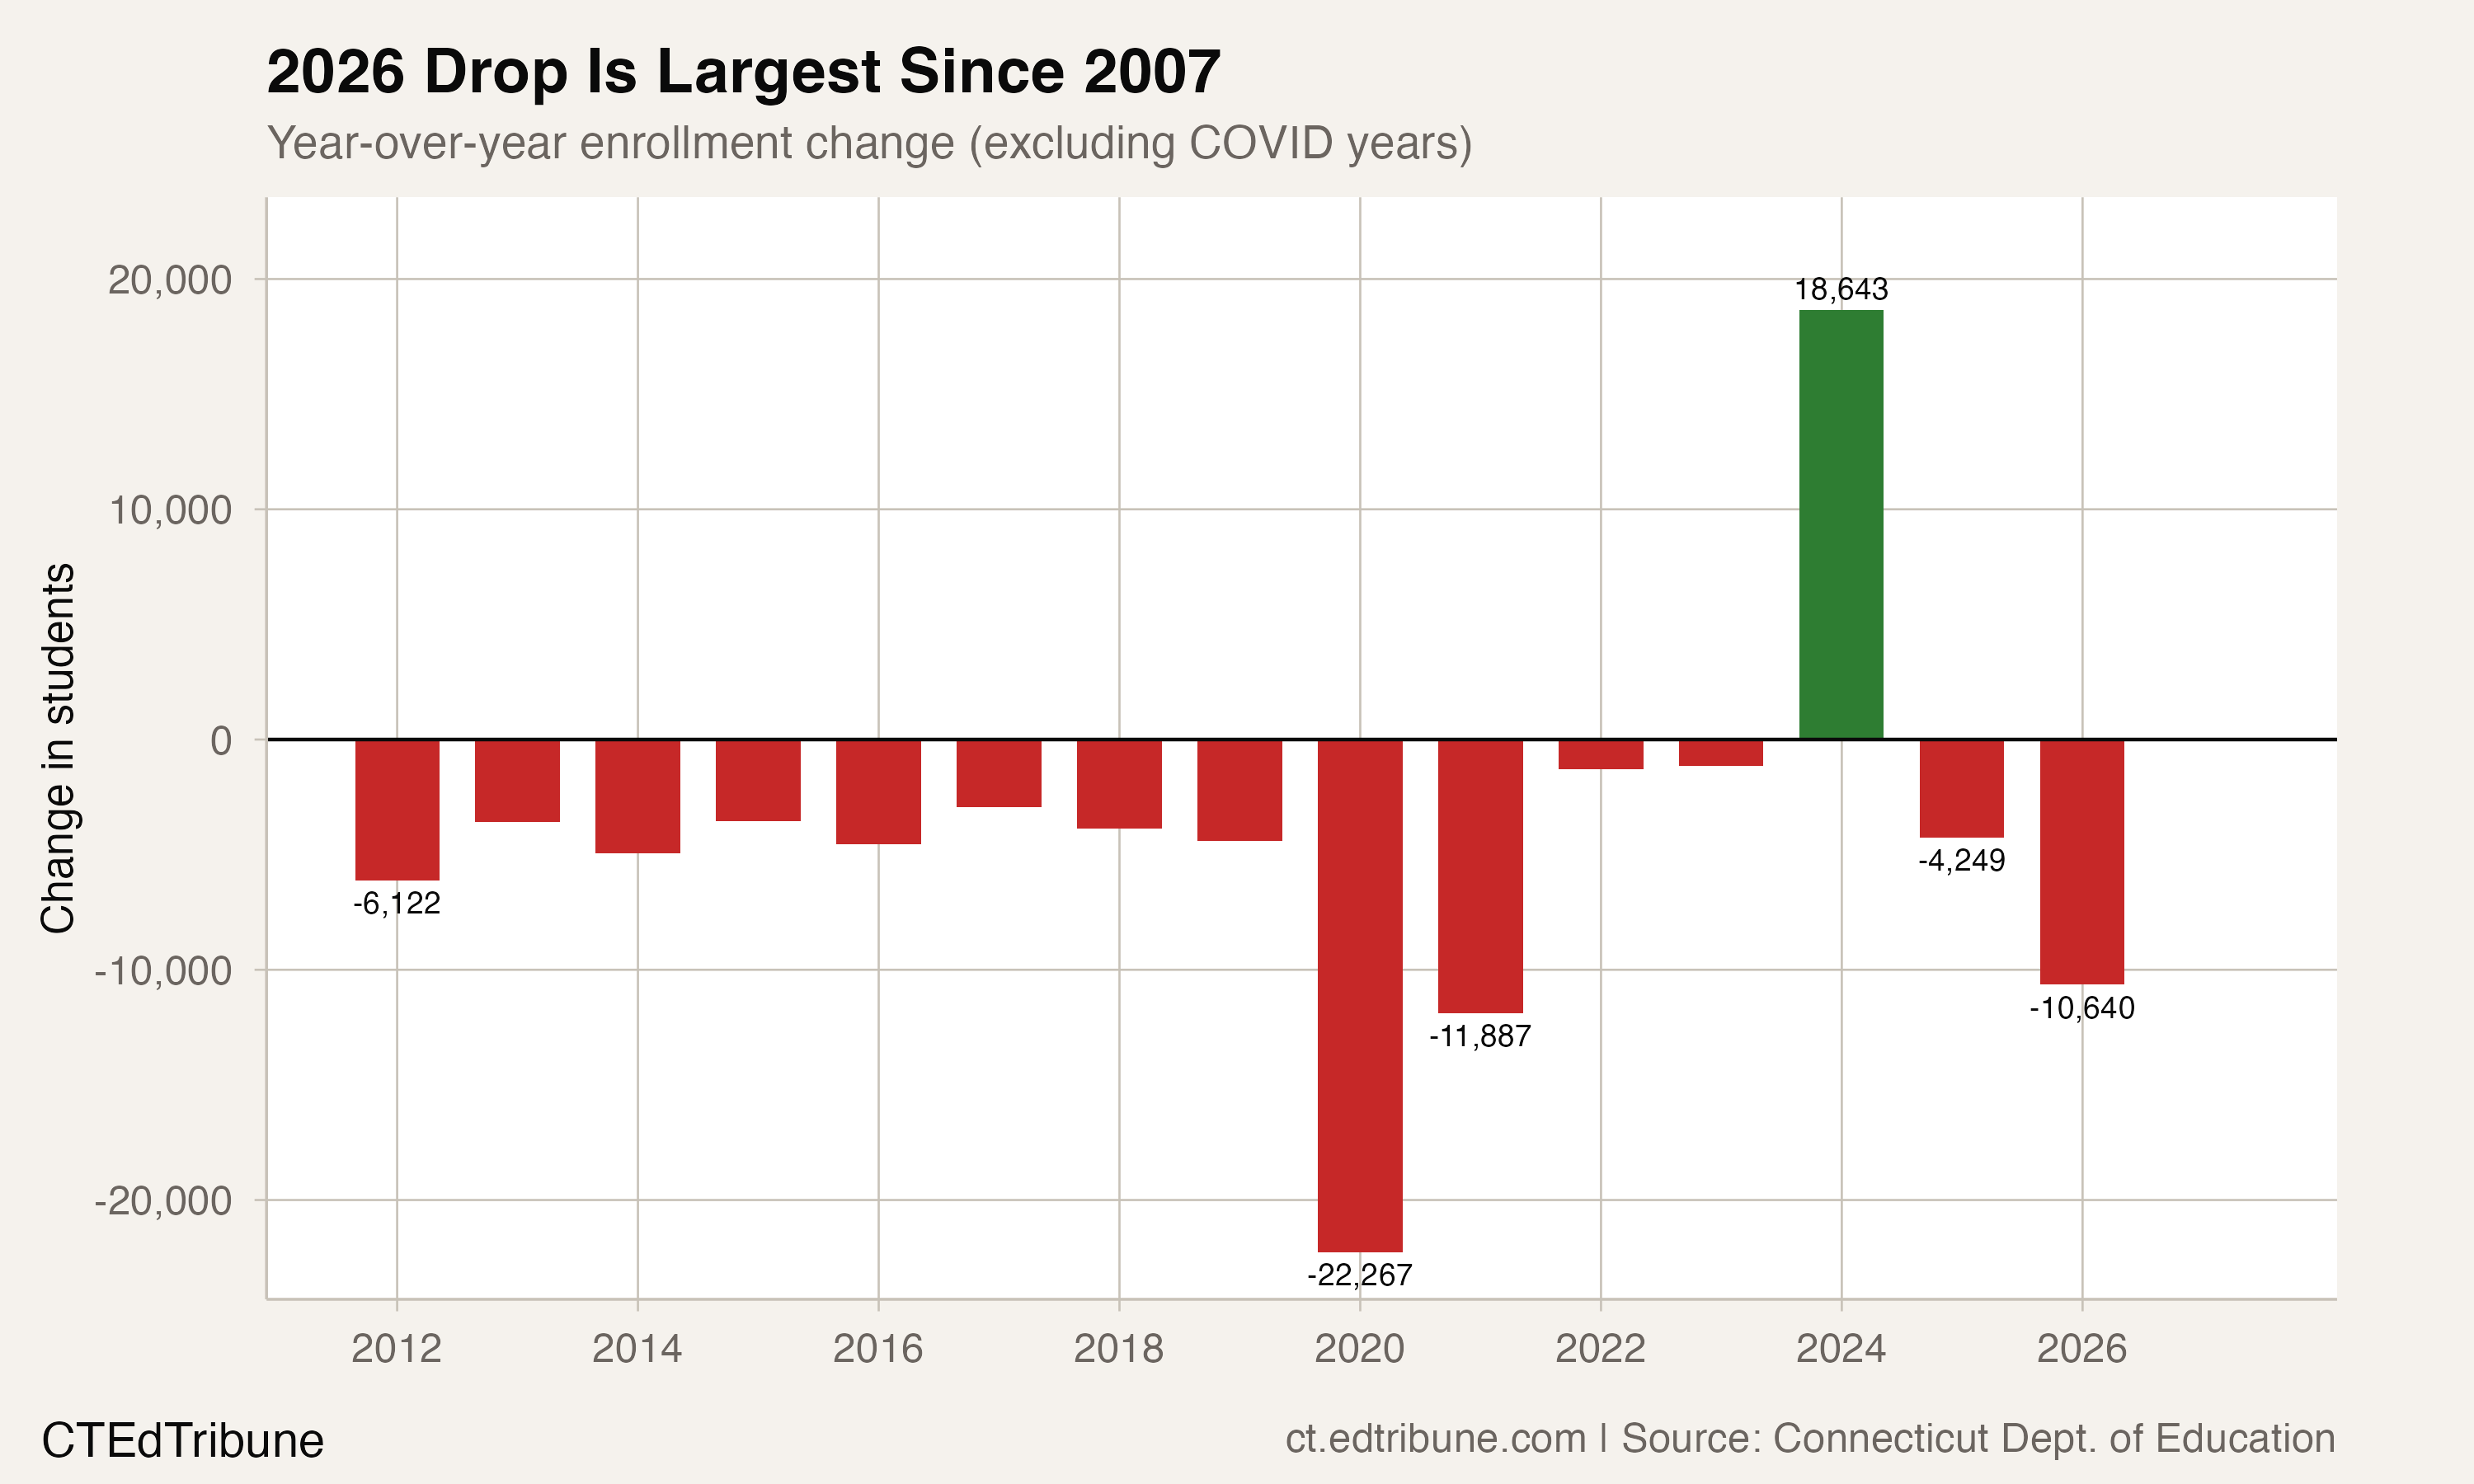
The 2025-26 drop of 10,640 students is 2.5 times the average pre-COVID annual loss. Only the 2020-21 pandemic year was worse.
The plateau that masked the trajectory
The years after the pandemic looked, at first glance, like stabilization. Enrollment ticked up by 536 in 2021-22 and barely moved in 2022-23 (down 102) and 2023-24 (down 862). After the COVID shock of 2020-21, when the state lost 14,752 students in a single year, three years of near-flat enrollment felt like the floor had been found.
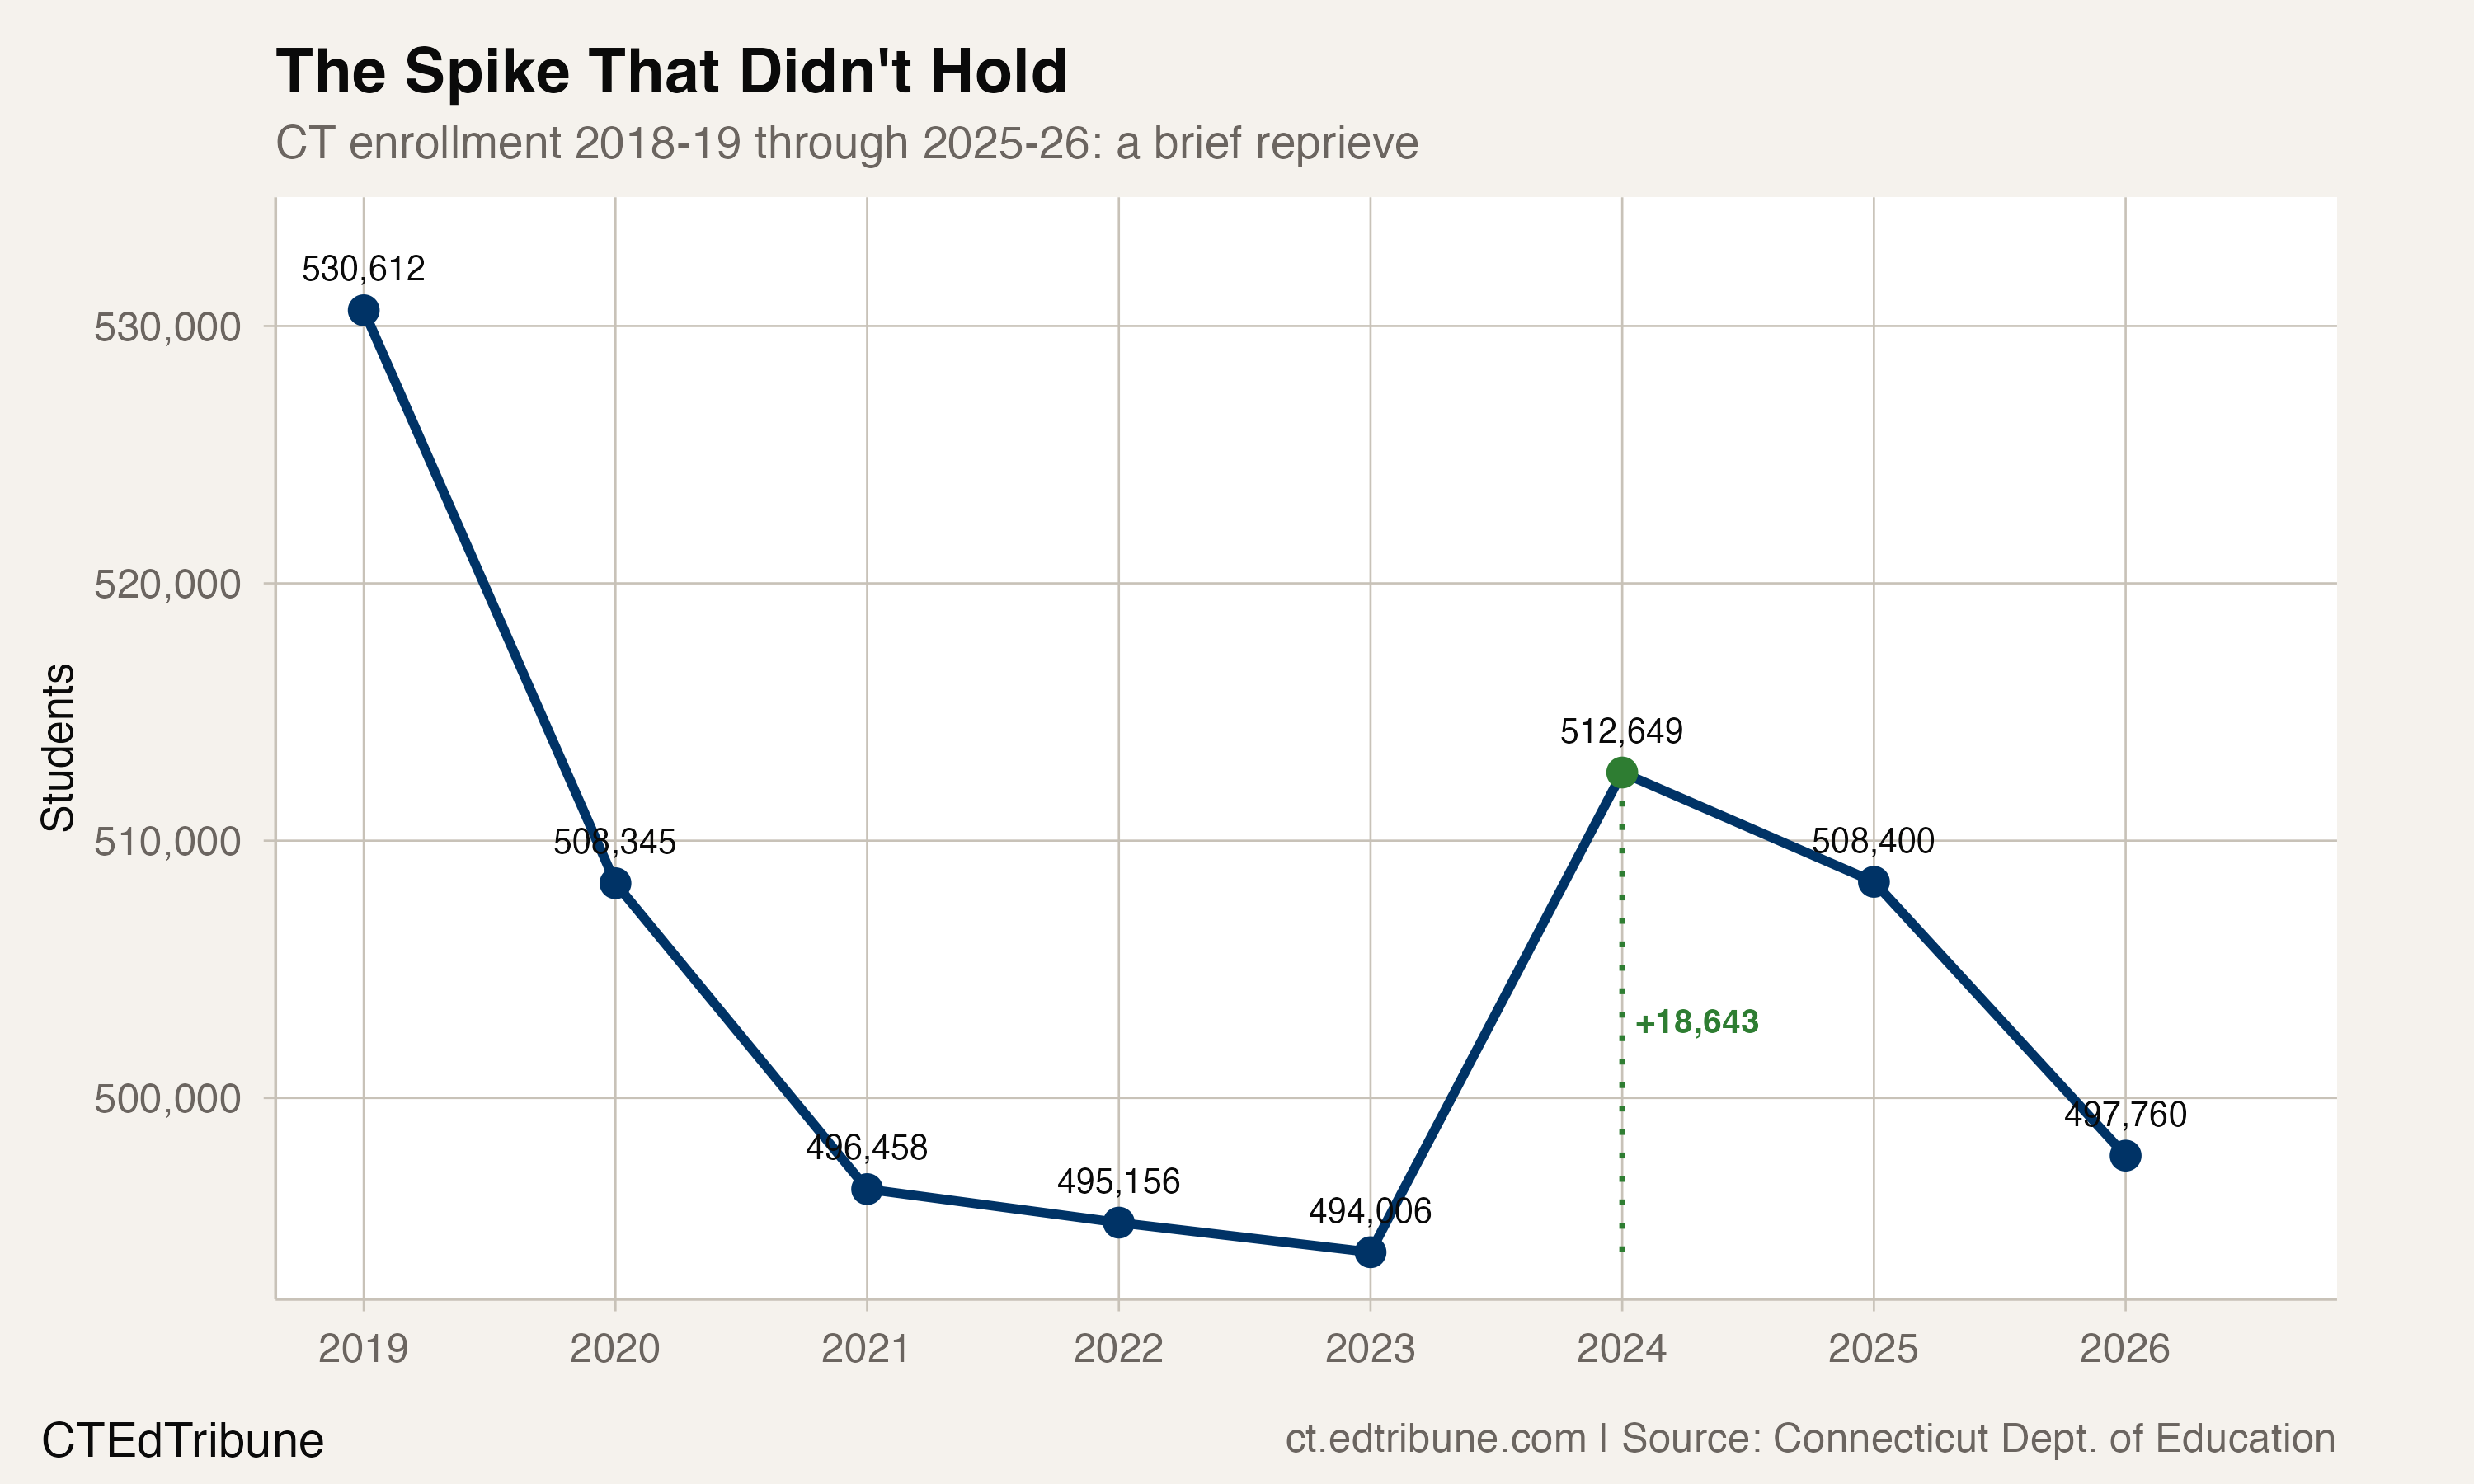
It hadn't. The 2024-25 decline of 4,249 was already larger than the pre-COVID annual average. Then 2025-26 delivered 10,640, more than doubling the pace. The three-year plateau from 2022 to 2024 now looks less like equilibrium and more like a pause before a steeper drop, driven by smaller kindergarten cohorts finally working their way through the system and compounded by the state's kindergarten age cutoff change, which shifted the birthday threshold from January 1 to September 1 in fall 2024.
HartfordET, which had stabilized around 16,400-16,800 students during the plateau years, dropped to 15,563 in 2025-26. New HavenET fell to 17,837. StamfordET shed 843 students.
Where the losses concentrate
Ten districts account for the deepest absolute losses since 2023-24. Hartford, New Haven, and Stamford each lost roughly 1,000 or more students. DanburyET lost 676, Waterbury 575.
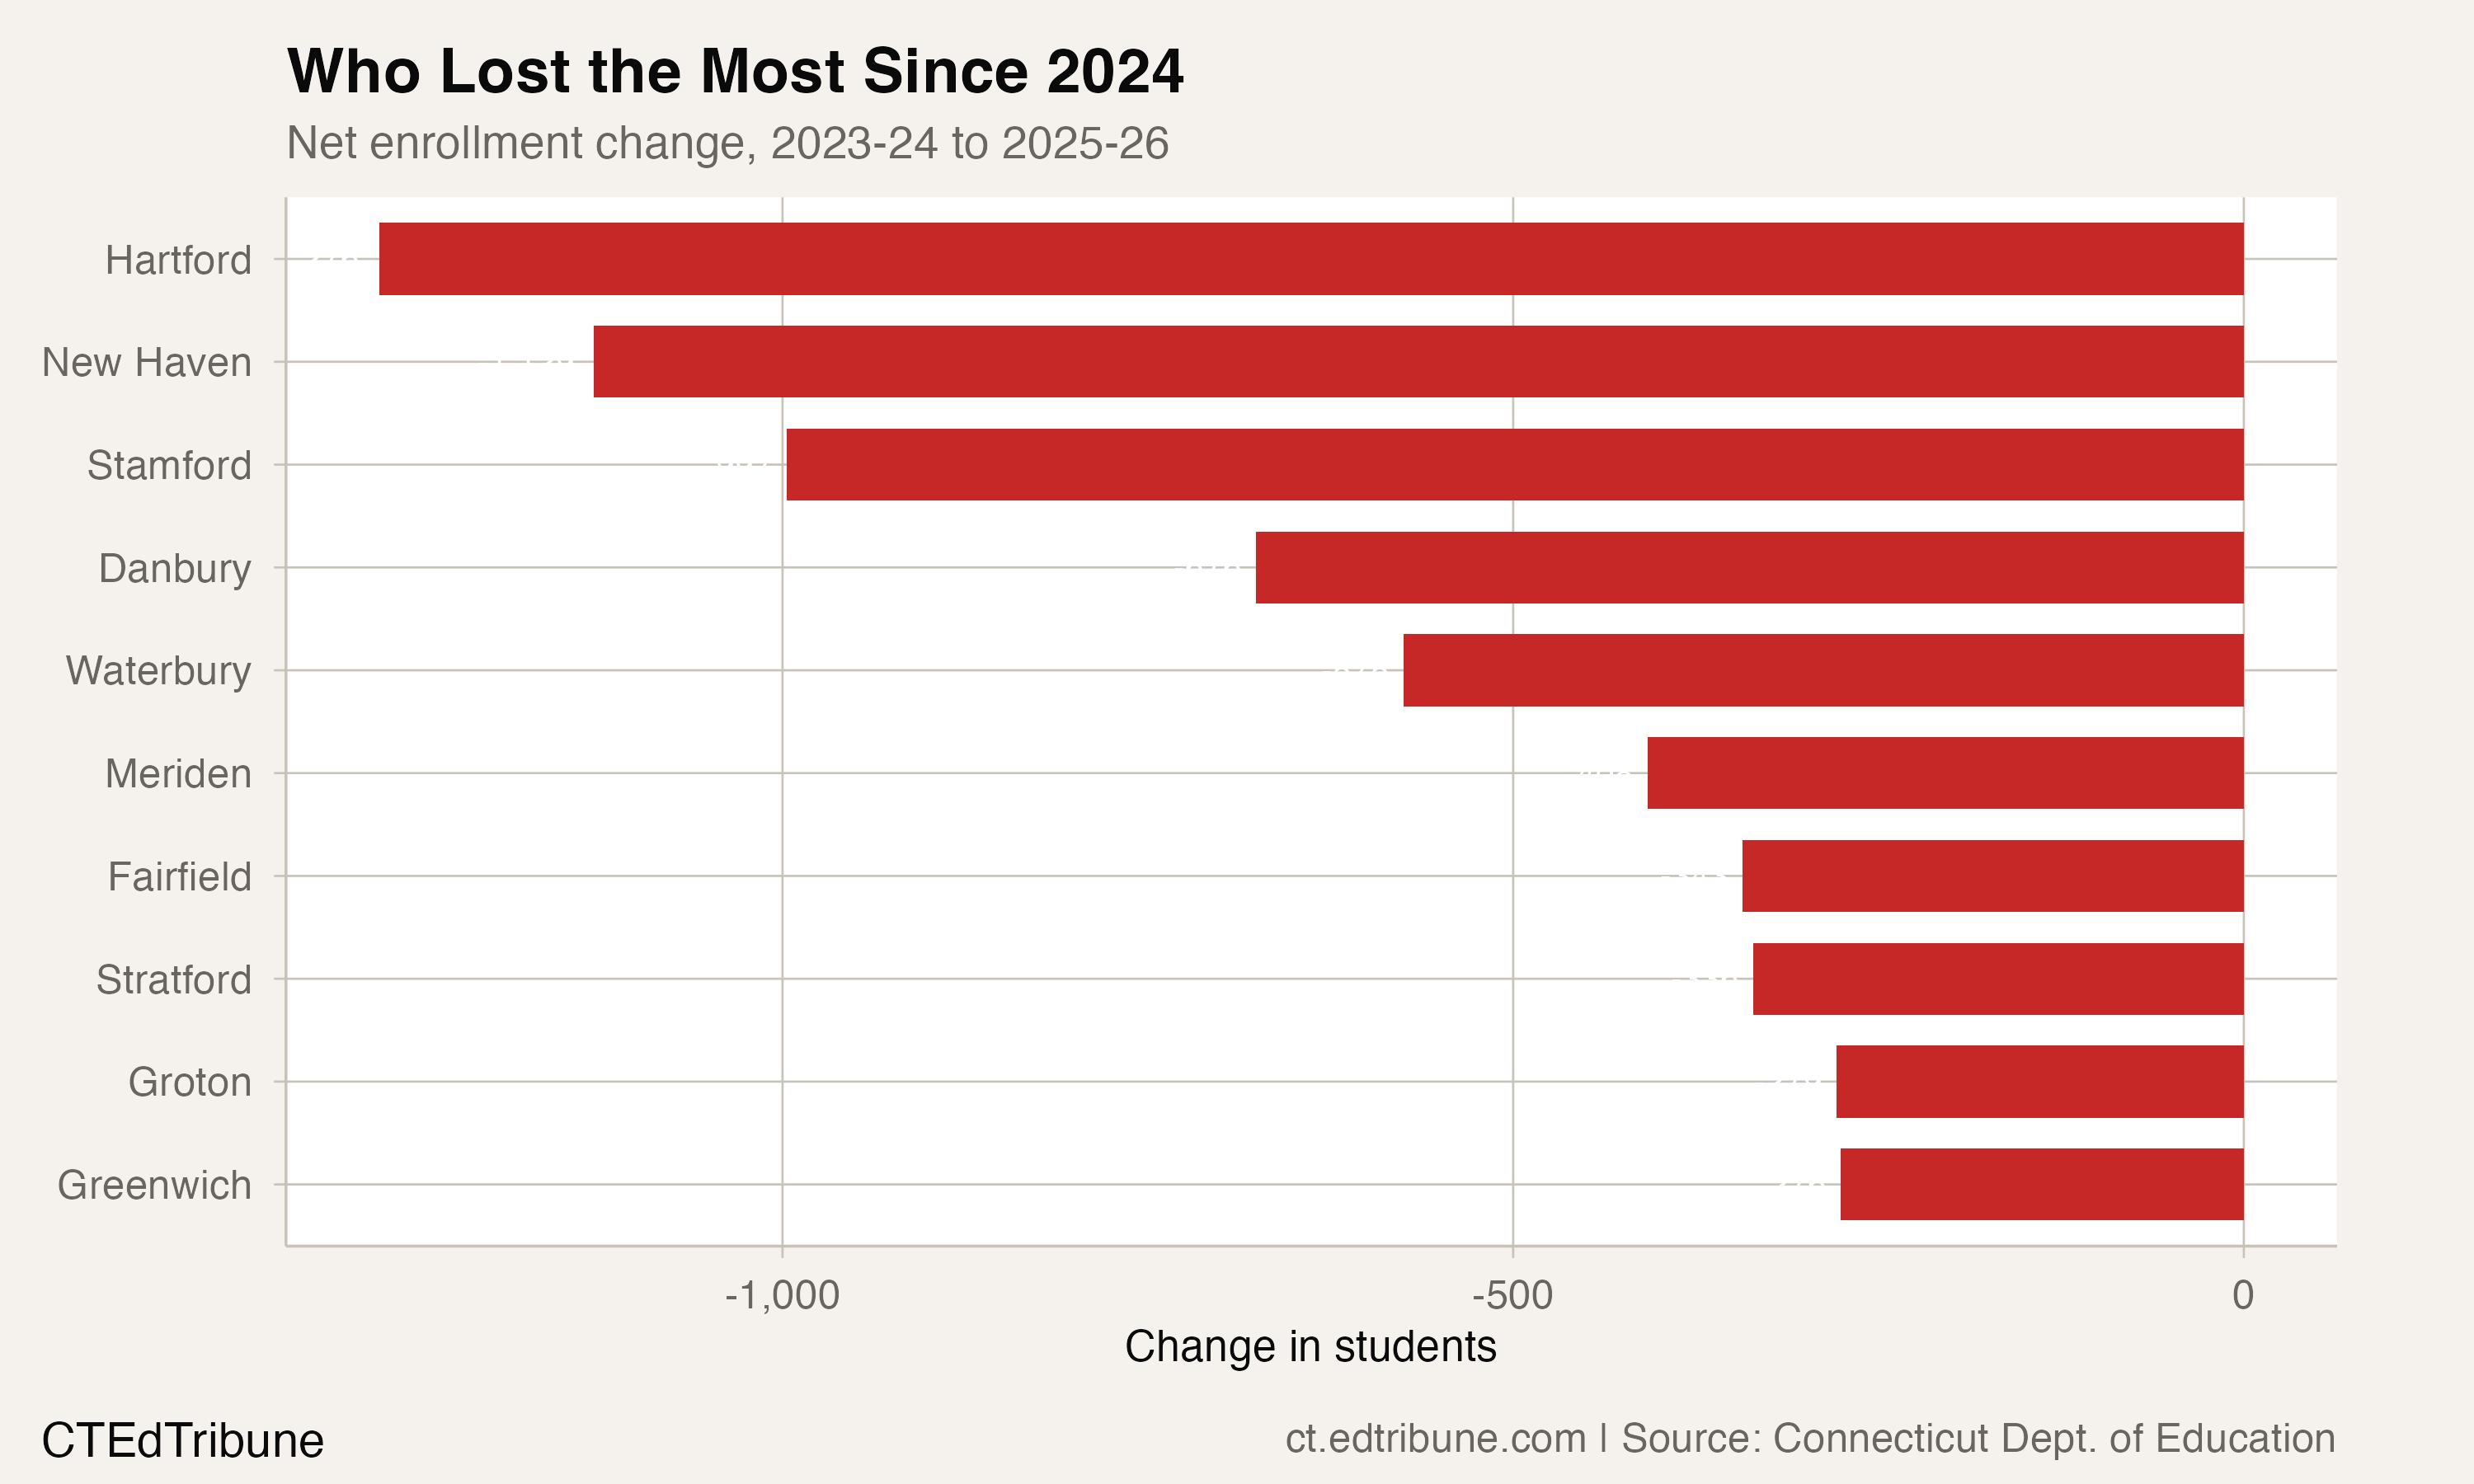
The losses span geography and demographics. Stamford, Greenwich, and Fairfield are affluent Gold Coast suburbs. Hartford, New Haven, and Waterbury are the state's poorest cities. Groton, a southeastern shoreline town, lost 279 students, a 6.8% decline from a base of just 4,099.
More than half of all Connecticut districts, 102 of 198 with at least five years of data, enrolled fewer students in 2025-26 than in any prior year on record. That list includes Stamford (15,342), Fairfield (9,012), Greenwich (8,313), and Ridgefield (4,389). These are not economically distressed communities. When affluent districts with strong school reputations hit historic lows, the forces at work are demographic, not merely competitive.
A kindergarten class that keeps shrinking
The pipeline tells a clearer story than the aggregate. Connecticut enrolled 39,727 kindergartners in 2010-11. In 2025-26, that number was 31,296, a 21.2% decline. Grade 12, by contrast, has been comparatively stable: 42,318 seniors in 2011, 40,970 in 2026.
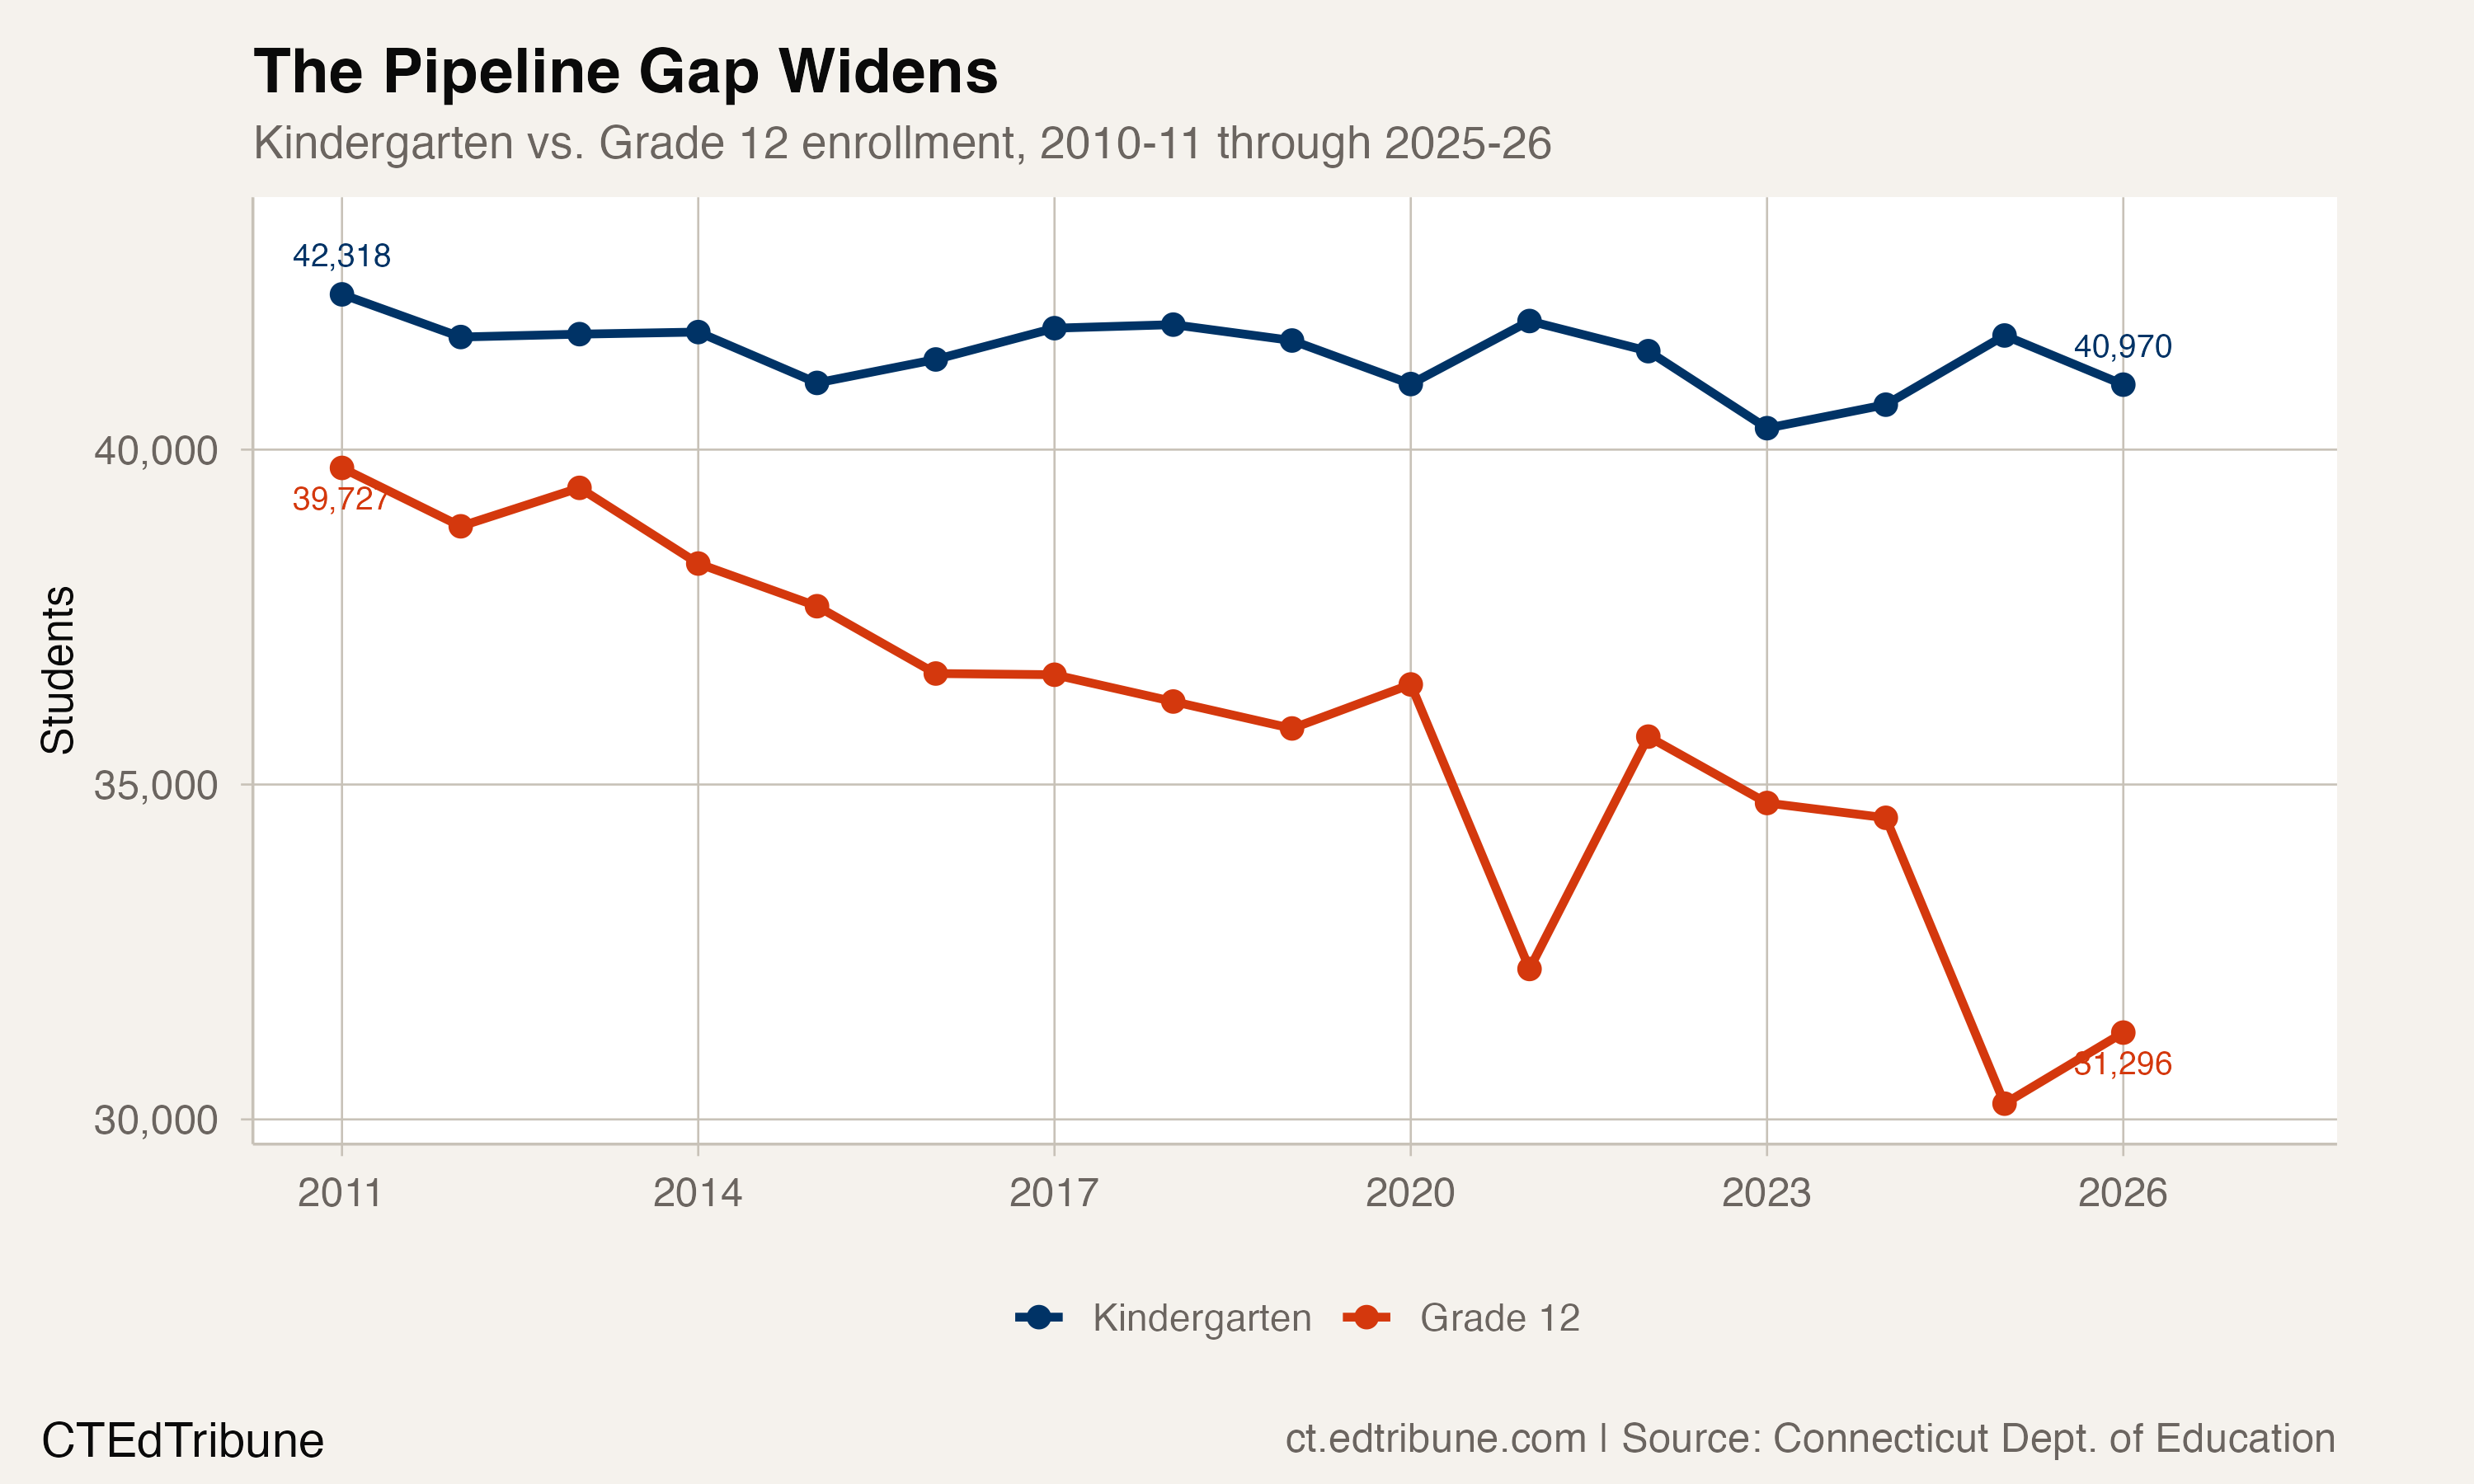
The gap between kindergarten and 12th grade has inverted. In 2011, there were 2,591 more seniors than kindergartners. By 2026, the gap has grown to 9,674. Each year, smaller kindergarten classes enter the system while larger cohorts graduate out, creating a structural decline that no policy intervention can reverse quickly. The children who will be kindergartners in 2030 have already been born. If Connecticut's birth trends mirror national ones, those cohorts will be smaller still.
Connecticut changed its kindergarten entry age cutoff from January 1 to September 1 starting in fall 2024, which may have contributed to the especially sharp kindergarten drop in 2024-25 (30,235, down 4,268 from the prior year). The 2025-26 rebound to 31,296 suggests some of that dip was a one-time adjustment rather than purely demographic.
The ELL signal
English learner enrollment tells a different story from the overall trend. Connecticut enrolled 30,635 English learners in 2010-11, representing 5.4% of total enrollment. By 2024-25, that number had nearly doubled to 57,447, or 11.3% of total enrollment. Even as the student body shrank by 66,739 students, the English learner population grew by more than 24,000.
Then, in 2025-26, English learner enrollment dropped by 2,157 to 55,290, the steepest non-COVID decline in the dataset.
The timing is difficult to separate from federal immigration enforcement policy. In January 2025, the Trump administration reversed guidance that had prevented immigration enforcement agents from making arrests at schools. Connecticut advocates have linked the ELL enrollment decline to families' fear of deportation, particularly in districts with large immigrant populations. Hartford alone lost 365 English learners. Danbury, which has one of the state's largest multilingual student populations, also saw declines.
Whether these students have left the state, shifted to private schools, or simply stopped attending is unknown. The data shows only that they are no longer on public school rosters.
What funding looks like when the floor drops
Connecticut's Education Cost Sharing formula ties state aid to enrollment counts. Under normal circumstances, losing 10,640 students would translate directly into reduced funding. But Connecticut has maintained a hold harmless provision since FY 2022 that prevents districts from losing state funding when enrollment drops. Without it, Ajit Gopalakrishnan, the state Education Department's Chief Performance Officer, told legislators the state would collectively lose more than $200 million.
"The only other year of decline was during the COVID year, when in October there [was a] greater percentage decline." — Ajit Gopalakrishnan, Chief Performance Officer, CT Dept. of Education, Feb. 2026
The hold harmless provision insulates budgets from the enrollment formula, but it does not solve the operational problem. Hartford, which has lost 5,802 students since 2010-11 (a 27.2% decline), faces a $30 million budget shortfall driven by rising special education costs and federal funding cuts. The district is maintaining buildings designed for roughly twice its current enrollment, and nearly half of Hartford students now learn outside the traditional district through magnet schools and open choice programs.
COVID never ended, for enrollment
Of the 174 Connecticut districts that lost students during COVID, only 32 have recovered to their pre-pandemic levels. That is an 18.4% recovery rate, among the lowest of any state The CTEdTribune has analyzed.
The state sits 32,851 students below its pre-pandemic enrollment of 530,611. The pandemic did not cause a temporary disruption that resolved itself. It accelerated a structural decline, and the acceleration has held.
What comes next
The 500,000 threshold is symbolic, but the math behind it is not. Kindergarten classes are producing fewer students than the senior classes they will eventually replace. The brief post-COVID plateau from 2022 to 2024 masked a structural decline that has now resumed at an accelerated pace. English learner enrollment, the one subgroup that had consistently grown even as the system shrank, is now declining too.
The question is whether Connecticut's hold harmless policy can survive another decade of this trajectory. The provision costs the state more than $200 million annually in funding that districts would otherwise lose. At some point, the gap between funded enrollment and actual enrollment becomes a political problem. The students walking out of Connecticut's schools in June 2026 outnumber the ones who will walk in come September.
Detailed code that reproduces the analysis and figures in this article is available exclusively to EdTribune subscribers.
Discussion
Sign in to join the discussion.
Loading comments...